 SlintPlot

SlintPlot: native charts for Slint in Rust
SlintPlot draws charts with Slint's own Path, Rectangle and
Text elements. They are not images: charts stay sharp at any scale, follow the
theme and dark mode, and react to the mouse. Datasets are ordinary Slint models, so updating a row
updates the chart.
Cartesian charts
Line, bar, horizontal bar, scatter and bubble charts; stacked, mixed, stepped and filled variants.
Radial charts
Pie, doughnut, polar area, radar, radial bar and segmented ring charts.
Time and heatmaps
Time series with date axes, candlestick and OHLC charts, Gantt charts, matrix heatmaps, matrix charts of sized circles, tile grids and GitHub-style calendar heatmaps.
Hierarchies and business
Treemaps, sunbursts, funnels, waterfalls, dumbbells, gauges and bullet charts.
Interactive
Tooltips, hover highlights, clickable legends, click callbacks, zoom and pan, keyboard navigation.
Large datasets
Min-max decimation and on-demand data loading keep charts with millions of points responsive.
cargo install slintplot-gallery, or download it ready-built from the
releases page. See Example apps.Getting started
Compatibility
- Language
- Rust only. Slint's C++, JavaScript and Python APIs can't use SlintPlot.
- Versions
- Slint 1.18 or later, Rust 1.88 or later.
- Platforms
- Tested on macOS, Windows, Linux and in the browser (WebAssembly). Embedded (MCU) builds are untested.
- Renderers
- FemtoVG, Skia and the software renderer are tested. The software renderer needs Slint's
software-renderer-pathfeature, or charts aren't drawn. - Preview
- Charts aren't drawn in Slint's live preview or SlintPad, because their geometry is computed in Rust.
1. Add the dependencies
SlintPlot is used both as a regular dependency (the register! macro) and as a build dependency (to find its .slint files).
[dependencies]
slint = "1.18"
slintplot = "0.5"

[build-dependencies]
slint-build = "1.18"
slintplot = "0.5"
2. Make the library importable: build.rs
fn main() {
    let config = slint_build::CompilerConfiguration::new().with_library_paths(
        std::collections::HashMap::from([("slintplot".into(), slintplot::library_path())]),
    );
    slint_build::compile_with_config("ui/app.slint", config).unwrap();
}
3. Use a chart: ui/app.slint
import { ChartEngine, LineChart } from "@slintplot";
export { ChartEngine } // required, so Rust can connect it

export component App inherits Window {
    preferred-width: 800px;
    preferred-height: 500px;

    // Only the data and the properties that differ from their default.
    // The LineChart section lists every property.
    LineChart {
        title: "Revenue";
        labels: ["Jan", "Feb", "Mar", "Apr", "May", "Jun"];
        datasets: [
            { label: "2025", values: [12, 19, 8, 15, 22, 18], fill: true, tension: 0.4 },
            { label: "2026", values: [15, 22, 13, 24, 26, 30], tension: 0.4 },
        ];
    }
}
Import only the charts you use, plus ChartEngine, which must always be imported and exported. Charts you don't
import cost nothing: Slint generates code only for the components your UI uses. register! connects the whole engine either way.
4. Connect the engine: src/main.rs
slint::include_modules!();

fn main() -> Result<(), slint::PlatformError> {
    let app = App::new()?;
    slintplot::register!(app);
    app.run()
}software-renderer-path feature:
slint = { version = "1.18", features = ["software-renderer-path"] }.
How it works
Charts are Slint components. Geometry such as line paths, bar positions and axis ticks is computed in Rust by
the ChartEngine global's pure callbacks, which slintplot::register! connects.
Because the callbacks are pure, Slint recomputes them automatically when the chart's size, data or
theme changes.
- Data is a Slint model. Set it in
.slintor from Rust; changing a row updates the chart. - Colors are optional. Datasets and slices without a
colortake the next color of the active theme. - Two requirements: export
ChartEnginefrom your root.slintfile, and callslintplot::register!once after creating the component.
LineChart
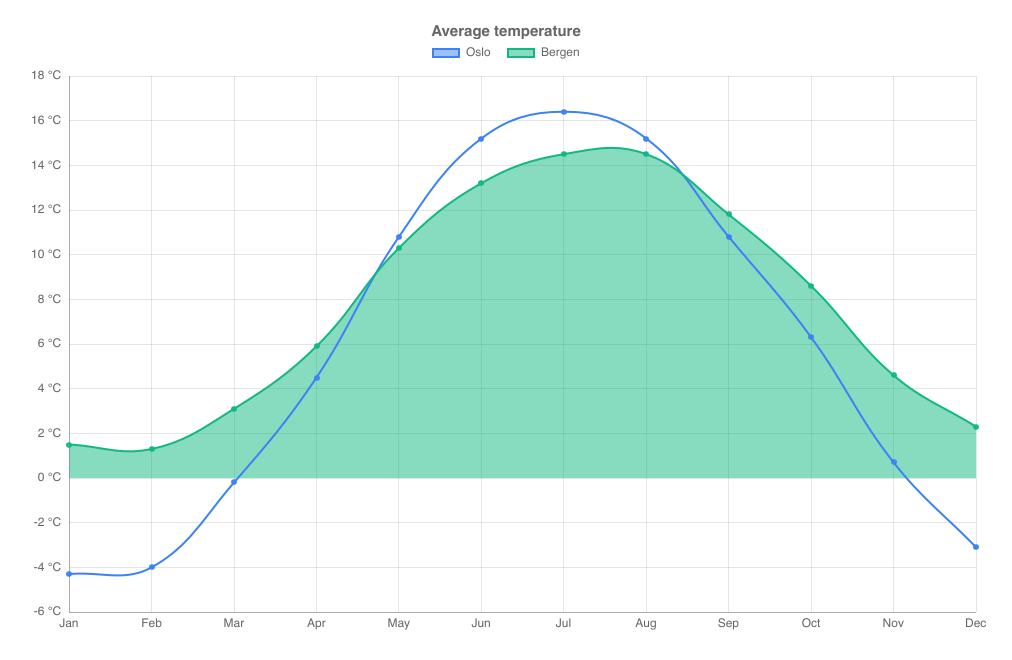
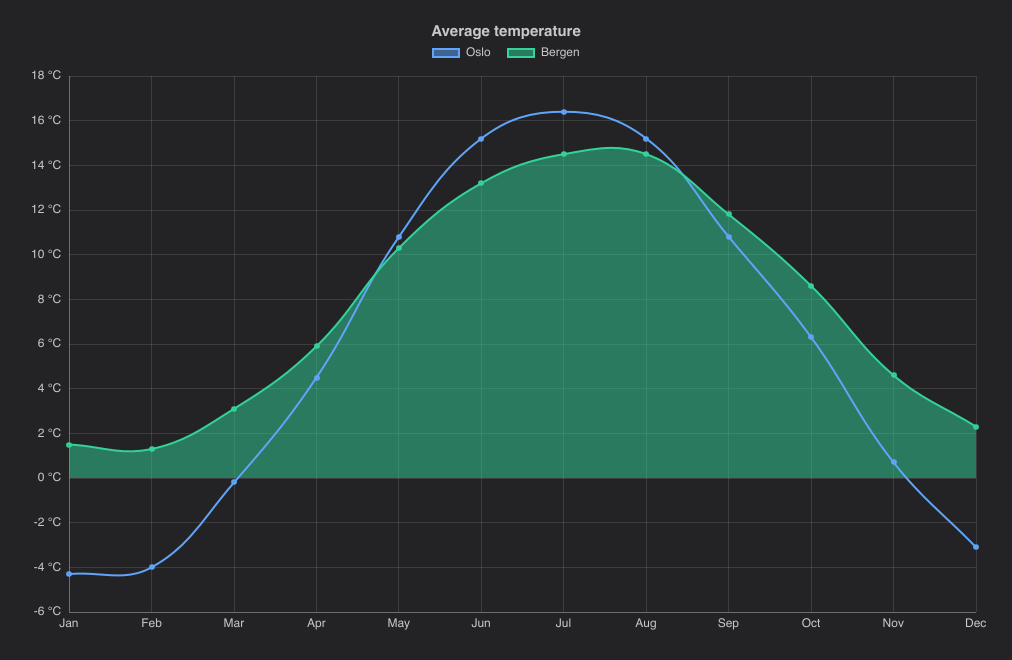
Lines through the values of each dataset, one point per label.
import { LineChart } from "@slintplot";

LineChart {
    title: "Average temperature";
    labels: ["Jan", "Feb", "Mar", "Apr", "May", "Jun", "Jul", "Aug", "Sep", "Oct", "Nov", "Dec"];
    datasets: [
        { label: "Oslo", values: [-4.3, -4.0, -0.2, 4.5, 10.8, 15.2, 16.4, 15.2, 10.8, 6.3, 0.7, -3.1], tension: 0.4 },
        { label: "Bergen", values: [1.5, 1.3, 3.1, 5.9, 10.3, 13.2, 14.5, 14.5, 11.8, 8.6, 4.6, 2.3], tension: 0.4, fill: true },
    ];
    value-suffix: " °C";
}| Property | Type | Default | Description |
|---|---|---|---|
datasets in-out | [ChartDataset] | The data, one entry per dataset: label, values, color, hidden, fill, tension, stepped, series-type, right-axis. See ChartDataset | |
labels | [string] | The categories on the x axis; each dataset has one value per label | |
title | string | "" | Shown above the chart |
show-points | bool | true | A marker on every point; turn off for large datasets |
show-values | bool | false | Write each value by its point |
fill-opacity | float | ChartTheme.fill-opacity | The opacity of filled marks: areas of datasets with fill: true. The theme's default is 0.5 |
show-legend | bool | true | A legend of the datasets; clicking an entry hides or shows one |
legend-position | ChartLegendPosition | top | top, bottom, left or right |
show-tooltip | bool | true | A tooltip with the values under the mouse |
animated | bool | true | Grow the data in when the chart appears, and move to new values |
begin-at-zero | bool | false | Include 0 in the value axis |
stacked | bool | false | Stack the datasets on top of each other |
x-title | string | "" | The title of the horizontal axis |
y-title | string | "" | The title of the vertical axis |
fixed-range | bool | false | Use min-value and max-value instead of fitting the value axis to the data |
min-value | float | 0 | The start of the value axis, with fixed-range |
max-value | float | 100 | The end of the value axis, with fixed-range |
integer-ticks | bool | false | Count in whole numbers: the value axis steps by at least 1, for values that are counted (people, items), where a short range otherwise gets ticks at 0.5 or 0.2 |
logarithmic | bool | false | A logarithmic value axis, for values that span several powers of ten |
value-prefix | string | "" | Written before every value, such as $ |
value-suffix | string | "" | Written after every value, such as % |
value-decimals | int | -1 | Decimals of every value; -1 picks them from the data |
y2-title, y2-begin-at-zero, y2-fixed-range, y2-min-value, y2-max-value, y2-logarithmic, y2-value-prefix, y2-value-suffix, y2-value-decimals | as without y2- | The second value axis, on the right, for datasets with right-axis: true. See A second value axis | |
decimate | bool | true | Draw a line with more points than pixels as one span per pixel column; turn off to draw every point |
zoom-enabled | bool | false | The mouse wheel zooms the x axis around the mouse, dragging pans, and a double-click resets |
view-start in-out | float | 0 | The start of the visible part of the x axis, from 0 to 1; set it to zoom from code |
view-end in-out | float | 1 | The end of the visible part of the x axis, from 0 to 1 |
min-view | float | 0.0005 | The smallest part of the x axis a zoom can show |
zoomed out | bool | Whether the chart is zoomed in | |
hovered-index out | int | The category under the mouse or selected with the keyboard, or -1 | |
category-clicked(index) | callback | A category was clicked, or chosen with Enter | |
legend-toggled(index) | callback | A legend entry hid or showed a dataset |
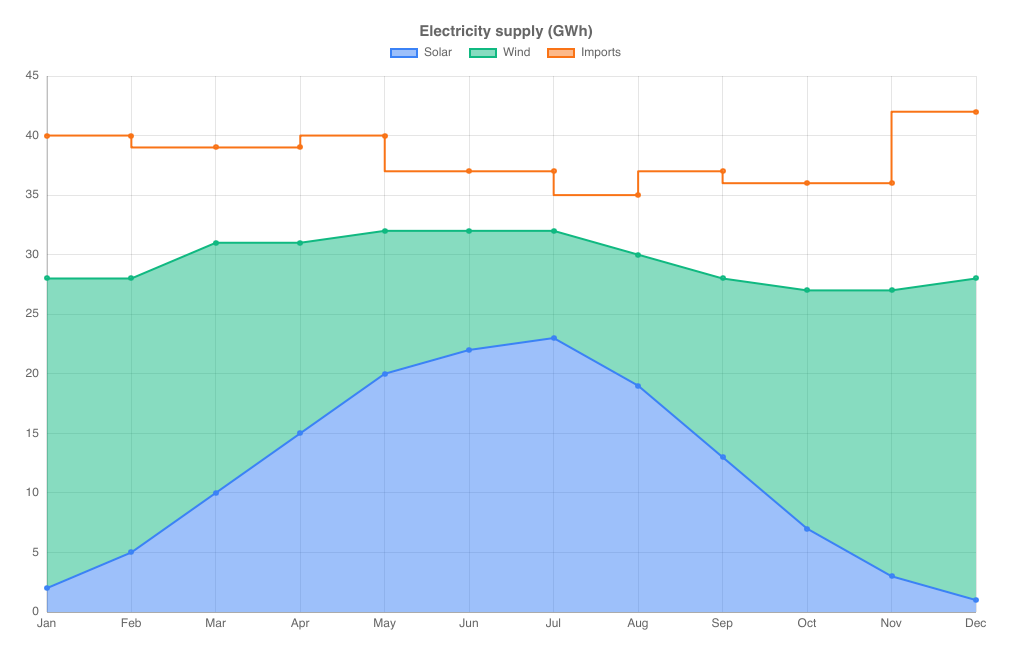
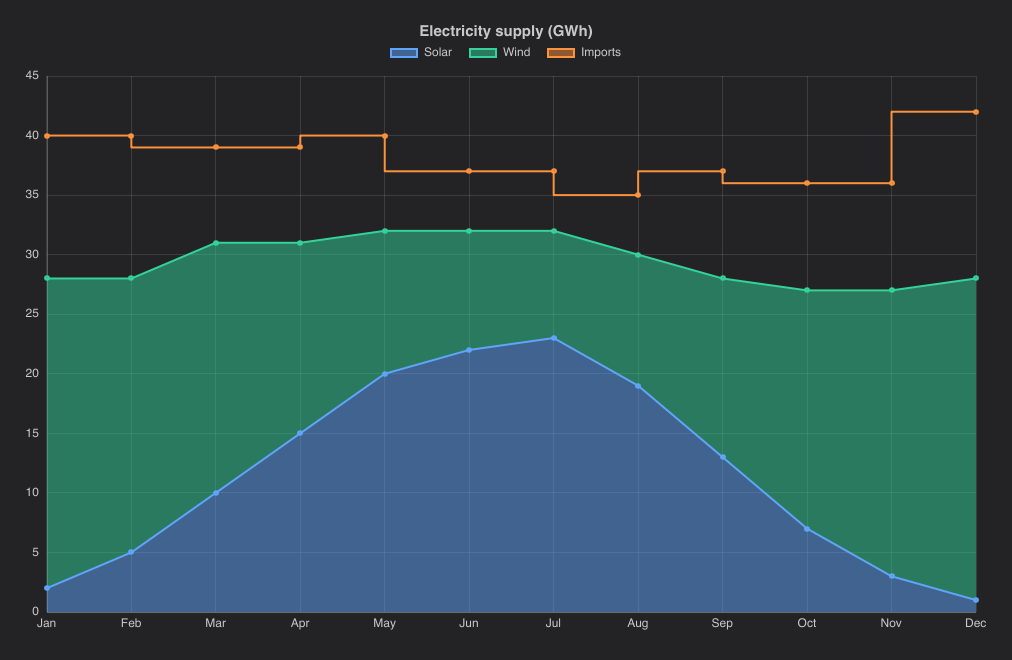
Dataset options that apply to lines: tension (0 for straight segments, about 0.4 for smooth curves),
fill (fill to the axis, or to the dataset below when stacked) and stepped (steps instead of slopes).
All properties are listed under Cartesian properties.
Stepped and stacked lines
import { LineChart } from "@slintplot";

LineChart {
    title: "Electricity supply (GWh)";
    labels: ["Jan", "Feb", "Mar", "Apr", "May", "Jun", "Jul", "Aug", "Sep", "Oct", "Nov", "Dec"];
    datasets: [
        { label: "Solar", values: [2, 5, 10, 15, 20, 22, 23, 19, 13, 7, 3, 1], fill: true },
        { label: "Wind", values: [26, 23, 21, 16, 12, 10, 9, 11, 15, 20, 24, 27], fill: true },
        { label: "Imports", values: [12, 12, 8, 8, 8, 5, 5, 5, 9, 9, 9, 14], stepped: true },
    ];
    stacked: true;
}
BarChart
Vertical bars, grouped by default and stacked with stacked: true. The value axis begins at zero.
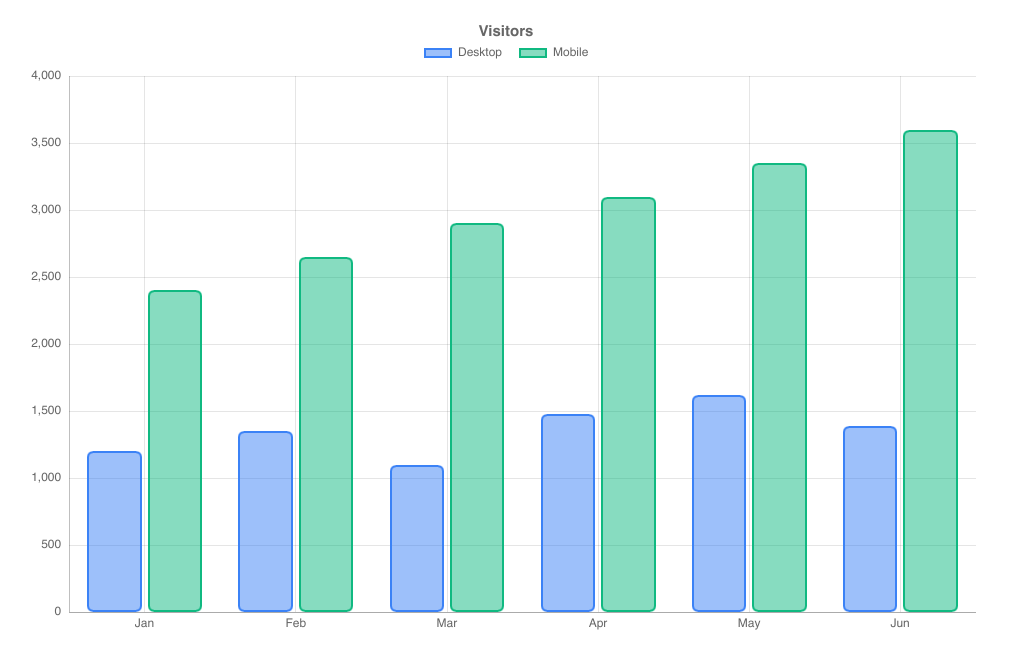
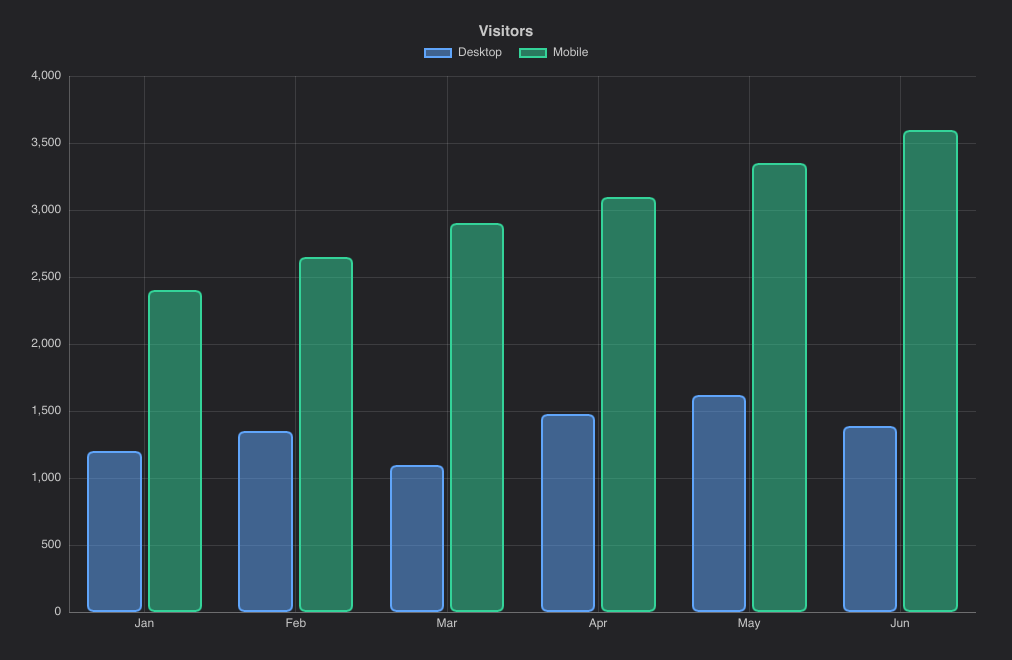
import { BarChart } from "@slintplot";

BarChart {
    title: "Visitors";
    labels: ["Jan", "Feb", "Mar", "Apr", "May", "Jun"];
    datasets: [
        { label: "Desktop", values: [1200, 1350, 1100, 1480, 1620, 1390] },
        { label: "Mobile", values: [2400, 2650, 2900, 3100, 3350, 3600] },
    ];
    bar-radius: 6px;
    bar-border-width: 2px;
}| Property | Type | Default | Description |
|---|---|---|---|
datasets in-out | [ChartDataset] | The data, one entry per dataset: label, values, color, hidden, series-type, right-axis. See ChartDataset | |
labels | [string] | The categories on the x axis; each dataset has one value per label | |
title | string | "" | Shown above the chart |
show-values | bool | false | Write each value on its bar |
fill-opacity | float | ChartTheme.fill-opacity | The opacity of filled marks: the bars. The theme's default is 0.5 |
bar-radius | length | 0 | Rounded bar corners; in a stacked chart, the ends of each stack |
bar-border-width | length | 1px | The width of the solid bar outline |
show-legend | bool | true | A legend of the datasets; clicking an entry hides or shows one |
legend-position | ChartLegendPosition | top | top, bottom, left or right |
show-tooltip | bool | true | A tooltip with the values under the mouse |
animated | bool | true | Grow the data in when the chart appears, and move to new values |
begin-at-zero | bool | true | Include 0 in the value axis |
stacked | bool | false | Stack the datasets; positive and negative values stack separately |
stacked-percent | bool | false | Split each bar into the datasets' shares, from 0 to 100%. See 100% stacked bars |
x-title | string | "" | The title of the horizontal axis |
y-title | string | "" | The title of the vertical axis |
fixed-range | bool | false | Use min-value and max-value instead of fitting the value axis to the data |
min-value | float | 0 | The start of the value axis, with fixed-range |
max-value | float | 100 | The end of the value axis, with fixed-range |
integer-ticks | bool | false | Count in whole numbers: the value axis steps by at least 1, for values that are counted (people, items), where a short range otherwise gets ticks at 0.5 or 0.2 |
logarithmic | bool | false | A logarithmic value axis, for values that span several powers of ten |
value-prefix | string | "" | Written before every value, such as $ |
value-suffix | string | "" | Written after every value, such as % |
value-decimals | int | -1 | Decimals of every value; -1 picks them from the data |
y2-title, y2-begin-at-zero, y2-fixed-range, y2-min-value, y2-max-value, y2-logarithmic, y2-value-prefix, y2-value-suffix, y2-value-decimals | as without y2- | The second value axis, on the right, for datasets with right-axis: true. See A second value axis | |
zoom-enabled | bool | false | The mouse wheel zooms the x axis around the mouse, dragging pans, and a double-click resets |
view-start in-out | float | 0 | The start of the visible part of the x axis, from 0 to 1; set it to zoom from code |
view-end in-out | float | 1 | The end of the visible part of the x axis, from 0 to 1 |
min-view | float | 0.0005 | The smallest part of the x axis a zoom can show |
zoomed out | bool | Whether the chart is zoomed in | |
hovered-index out | int | The category under the mouse or selected with the keyboard, or -1 | |
category-clicked(index) | callback | A category was clicked, or chosen with Enter | |
legend-toggled(index) | callback | A legend entry hid or showed a dataset |
When stacked, positive and negative values stack separately.
HorizontalBarChart
Categories run down the left side and bars grow to the right.
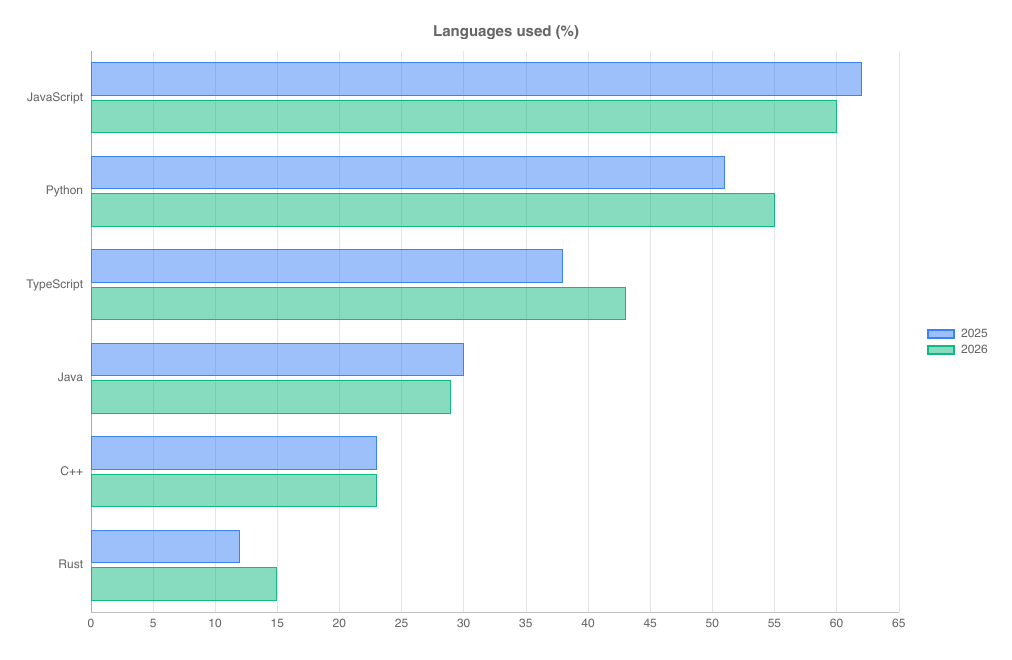
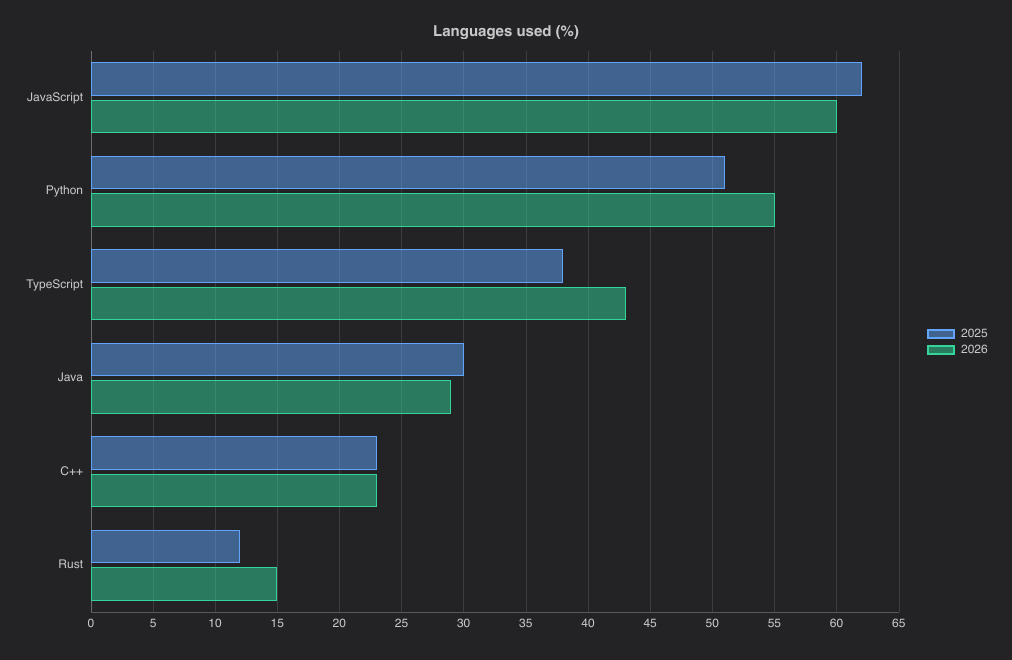
import { ChartLegendPosition, HorizontalBarChart } from "@slintplot";

HorizontalBarChart {
    title: "Languages used (%)";
    labels: ["JavaScript", "Python", "TypeScript", "Java", "C++", "Rust"];
    datasets: [
        { label: "2025", values: [62, 51, 38, 30, 23, 12] },
        { label: "2026", values: [60, 55, 43, 29, 23, 15] },
    ];
    legend-position: ChartLegendPosition.right;
}| Property | Type | Default | Description |
|---|---|---|---|
datasets in-out | [ChartDataset] | The data, one entry per dataset: label, values, color, hidden. See ChartDataset | |
labels | [string] | The categories down the left side; each dataset has one value per label | |
title | string | "" | Shown above the chart |
show-values | bool | false | Write each value on its bar |
fill-opacity | float | ChartTheme.fill-opacity | The opacity of filled marks: the bars. The theme's default is 0.5 |
bar-radius | length | 0 | Rounded bar corners; in a stacked chart, the ends of each stack |
bar-border-width | length | 1px | The width of the solid bar outline |
show-legend | bool | true | A legend of the datasets; clicking an entry hides or shows one |
legend-position | ChartLegendPosition | top | top, bottom, left or right |
show-tooltip | bool | true | A tooltip with the values under the mouse |
animated | bool | true | Grow the data in when the chart appears, and move to new values |
begin-at-zero | bool | true | Include 0 in the value axis |
stacked | bool | false | Stack the datasets end to end |
stacked-percent | bool | false | Split each bar into the datasets' shares, from 0 to 100%. See 100% stacked bars |
x-title | string | "" | The title of the value axis, at the bottom |
y-title | string | "" | The title of the category axis, on the left |
fixed-range | bool | false | Use min-value and max-value instead of fitting the value axis to the data |
min-value | float | 0 | The start of the value axis, with fixed-range |
max-value | float | 100 | The end of the value axis, with fixed-range |
integer-ticks | bool | false | Count in whole numbers: the value axis steps by at least 1, for values that are counted (people, items), where a short range otherwise gets ticks at 0.5 or 0.2 |
logarithmic | bool | false | A logarithmic value axis, for values that span several powers of ten |
value-prefix | string | "" | Written before every value, such as $ |
value-suffix | string | "" | Written after every value, such as % |
value-decimals | int | -1 | Decimals of every value; -1 picks them from the data |
hovered-index out | int | The category under the mouse or selected with the keyboard, or -1 | |
category-clicked(index) | callback | A category was clicked, or chosen with Enter | |
legend-toggled(index) | callback | A legend entry hid or showed a dataset |
ScatterChart
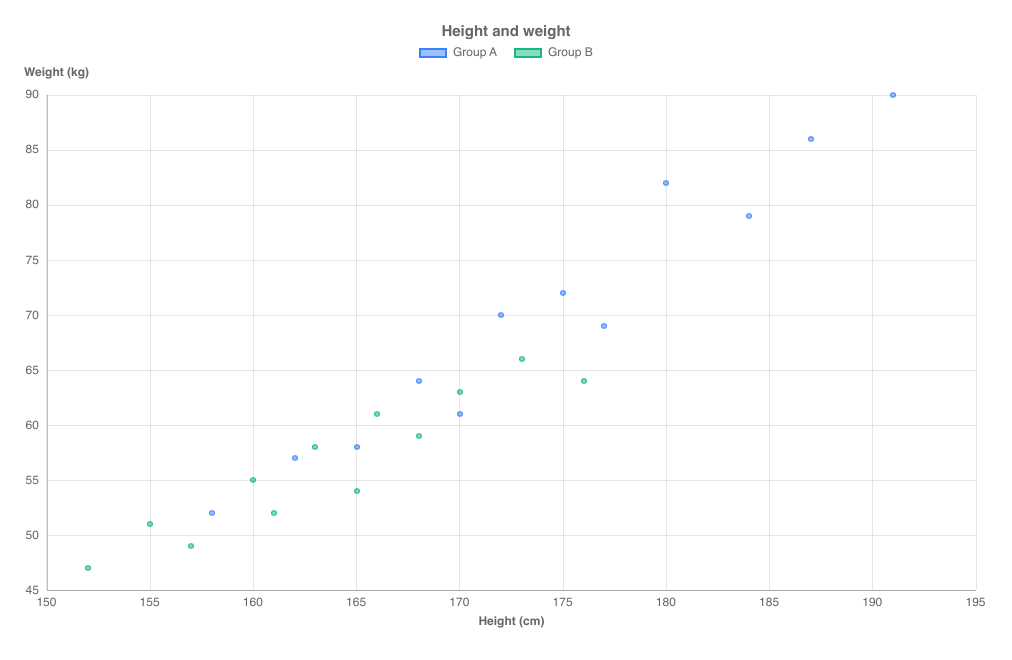
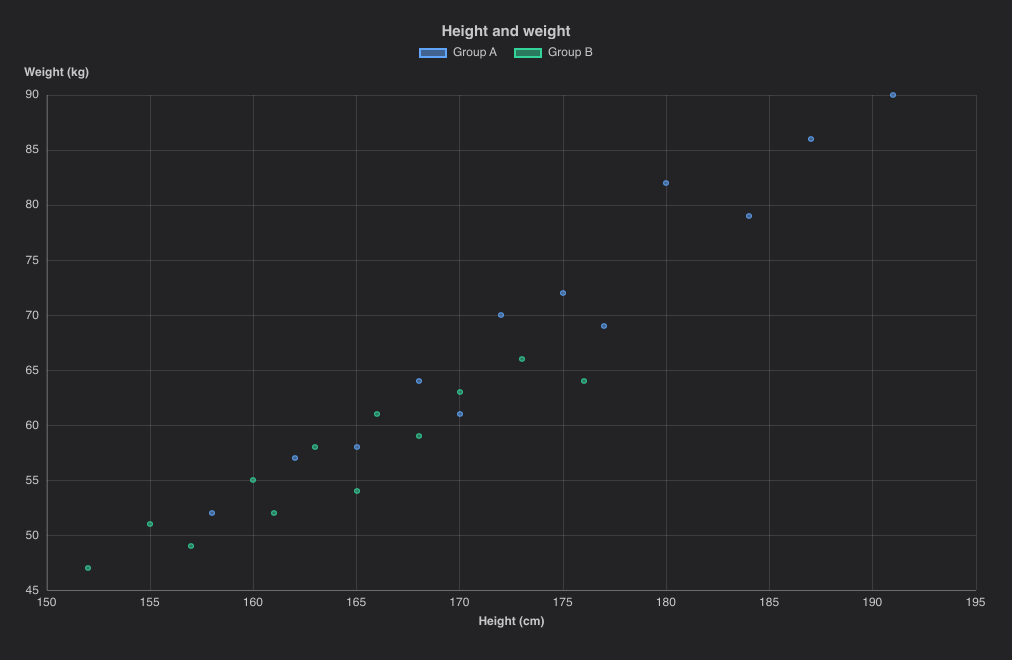
Points on numeric x and y axes. Datasets use points instead of values.
Hovering highlights the nearest point and shows its coordinates.
import { ScatterChart } from "@slintplot";

ScatterChart {
    title: "Height and weight";
    datasets: [
        {
            label: "Group A",
            points: [{ x: 158, y: 52 }, { x: 162, y: 57 }, { x: 165, y: 58 }, { x: 168, y: 64 }, { x: 170, y: 61 }, { x: 172, y: 70 },
                     { x: 175, y: 72 }, { x: 177, y: 69 }, { x: 180, y: 82 }, { x: 184, y: 79 }, { x: 187, y: 86 }, { x: 191, y: 90 }],
        },
        {
            label: "Group B",
            points: [{ x: 152, y: 47 }, { x: 155, y: 51 }, { x: 157, y: 49 }, { x: 160, y: 55 }, { x: 161, y: 52 }, { x: 163, y: 58 },
                     { x: 165, y: 54 }, { x: 166, y: 61 }, { x: 168, y: 59 }, { x: 170, y: 63 }, { x: 173, y: 66 }, { x: 176, y: 64 }],
        },
    ];
    x-title: "Height (cm)";
    y-title: "Weight (kg)";
    zoom-enabled: true;
}| Property | Type | Default | Description |
|---|---|---|---|
datasets in-out | [ChartDataset] | The data, one entry per dataset: label, points, color, hidden, right-axis. See ChartDataset. Each point is { x, y } | |
title | string | "" | Shown above the chart |
show-lines | bool | false | Connect the points of each dataset in order |
show-values | bool | false | Write each y value by its point |
fill-opacity | float | ChartTheme.fill-opacity | The opacity of filled marks: the points. The theme's default is 0.5 |
show-legend | bool | true | A legend of the datasets; clicking an entry hides or shows one |
legend-position | ChartLegendPosition | top | top, bottom, left or right |
show-tooltip | bool | true | A tooltip with the values under the mouse |
animated | bool | true | Grow the data in when the chart appears, and move to new values |
begin-at-zero | bool | false | Include 0 in the y axis |
x-title | string | "" | The title of the horizontal axis |
y-title | string | "" | The title of the vertical axis |
fixed-range | bool | false | Use min-value and max-value instead of fitting the value axis to the data |
min-value | float | 0 | The start of the value axis, with fixed-range |
max-value | float | 100 | The end of the value axis, with fixed-range |
integer-ticks | bool | false | Count in whole numbers: the value axis steps by at least 1, for values that are counted (people, items), where a short range otherwise gets ticks at 0.5 or 0.2 |
logarithmic | bool | false | A logarithmic value axis, for values that span several powers of ten |
value-prefix | string | "" | Written before every value, such as $ |
value-suffix | string | "" | Written after every value, such as % |
value-decimals | int | -1 | Decimals of every value; -1 picks them from the data |
y2-title, y2-begin-at-zero, y2-fixed-range, y2-min-value, y2-max-value, y2-logarithmic, y2-value-prefix, y2-value-suffix, y2-value-decimals | as without y2- | The second value axis, on the right, for datasets with right-axis: true. See A second value axis | |
zoom-enabled | bool | false | The mouse wheel zooms the x axis around the mouse, dragging pans, and a double-click resets |
view-start in-out | float | 0 | The start of the visible part of the x axis, from 0 to 1; set it to zoom from code |
view-end in-out | float | 1 | The end of the visible part of the x axis, from 0 to 1 |
min-view | float | 0.0005 | The smallest part of the x axis a zoom can show |
zoomed out | bool | Whether the chart is zoomed in | |
hovered-point out | ChartHit | The point under the mouse or selected with the keyboard; its dataset is -1 when there is none | |
point-clicked(dataset, index) | callback | A point was clicked, or chosen with Enter | |
legend-toggled(index) | callback | A legend entry hid or showed a dataset |
BubbleChart
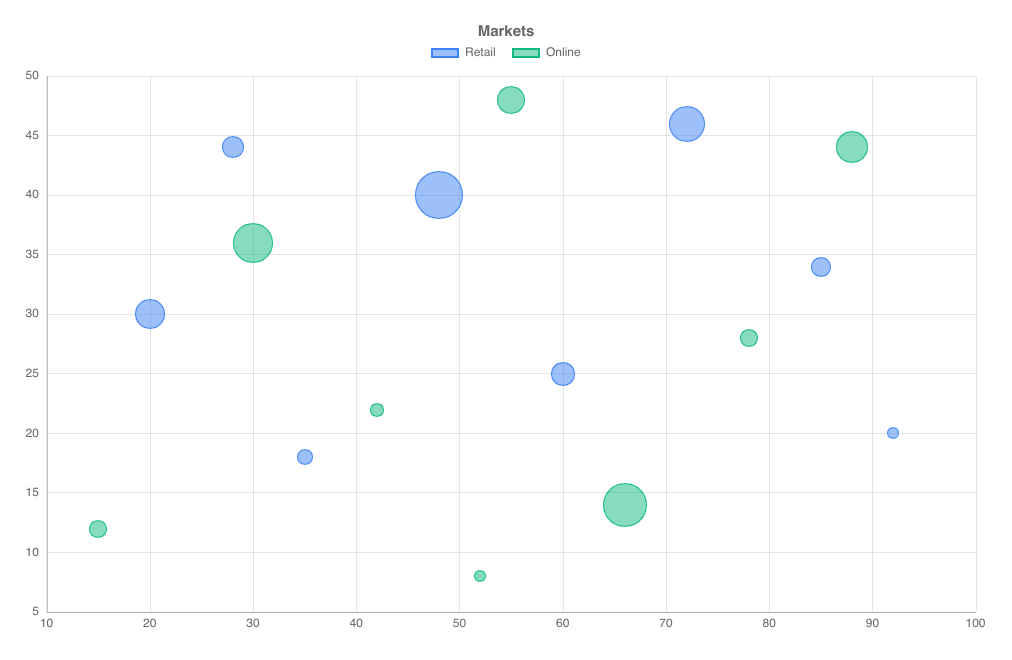
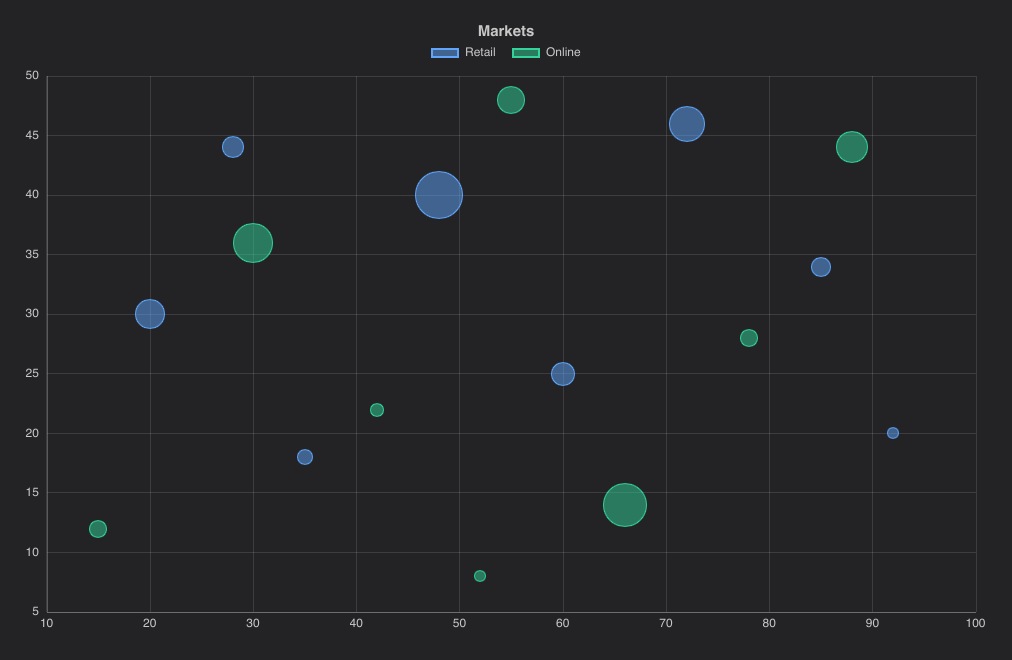
A scatter chart whose points have a radius: r is the bubble radius in pixels. Hovering works anywhere inside a bubble.
import { BubbleChart } from "@slintplot";

BubbleChart {
    title: "Markets";
    datasets: [
        {  // r: the bubble radius in pixels
            label: "Retail",
            points: [{ x: 20, y: 30, r: 15 }, { x: 35, y: 18, r: 8 }, { x: 48, y: 40, r: 24 }, { x: 60, y: 25, r: 12 },
                     { x: 72, y: 46, r: 18 }, { x: 85, y: 34, r: 10 }, { x: 28, y: 44, r: 11 }, { x: 92, y: 20, r: 6 }],
        },
        {
            label: "Online",
            points: [{ x: 15, y: 12, r: 9 }, { x: 30, y: 36, r: 20 }, { x: 42, y: 22, r: 7 }, { x: 55, y: 48, r: 14 },
                     { x: 66, y: 14, r: 22 }, { x: 78, y: 28, r: 9 }, { x: 88, y: 44, r: 16 }, { x: 52, y: 8, r: 6 }],
        },
    ];
}| Property | Type | Default | Description |
|---|---|---|---|
datasets in-out | [ChartDataset] | The data, one entry per dataset: label, points, color, hidden, right-axis. See ChartDataset. Each point is { x, y, r }; r is the radius in pixels | |
title | string | "" | Shown above the chart |
show-values | bool | false | Write each y value by its bubble |
fill-opacity | float | ChartTheme.fill-opacity | The opacity of filled marks: the bubbles. The theme's default is 0.5 |
show-legend | bool | true | A legend of the datasets; clicking an entry hides or shows one |
legend-position | ChartLegendPosition | top | top, bottom, left or right |
show-tooltip | bool | true | A tooltip with the values under the mouse |
animated | bool | true | Grow the data in when the chart appears, and move to new values |
begin-at-zero | bool | false | Include 0 in the y axis |
x-title | string | "" | The title of the horizontal axis |
y-title | string | "" | The title of the vertical axis |
fixed-range | bool | false | Use min-value and max-value instead of fitting the value axis to the data |
min-value | float | 0 | The start of the value axis, with fixed-range |
max-value | float | 100 | The end of the value axis, with fixed-range |
integer-ticks | bool | false | Count in whole numbers: the value axis steps by at least 1, for values that are counted (people, items), where a short range otherwise gets ticks at 0.5 or 0.2 |
logarithmic | bool | false | A logarithmic value axis, for values that span several powers of ten |
value-prefix | string | "" | Written before every value, such as $ |
value-suffix | string | "" | Written after every value, such as % |
value-decimals | int | -1 | Decimals of every value; -1 picks them from the data |
y2-title, y2-begin-at-zero, y2-fixed-range, y2-min-value, y2-max-value, y2-logarithmic, y2-value-prefix, y2-value-suffix, y2-value-decimals | as without y2- | The second value axis, on the right, for datasets with right-axis: true. See A second value axis | |
hovered-point out | ChartHit | The point under the mouse or selected with the keyboard; its dataset is -1 when there is none | |
point-clicked(dataset, index) | callback | A point was clicked, or chosen with Enter | |
legend-toggled(index) | callback | A legend entry hid or showed a dataset |
PieChart
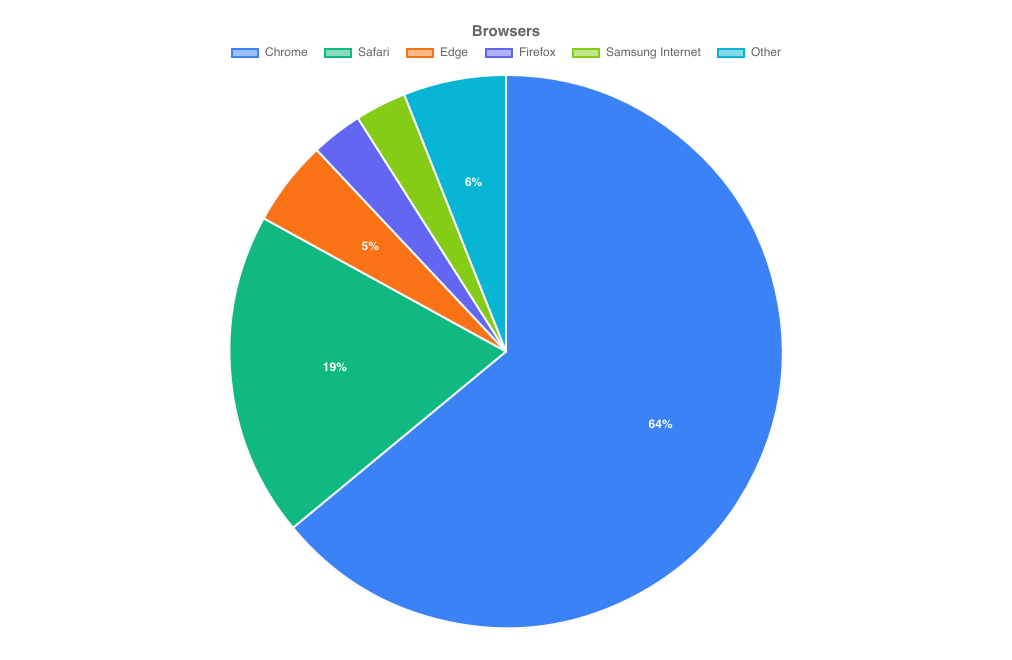
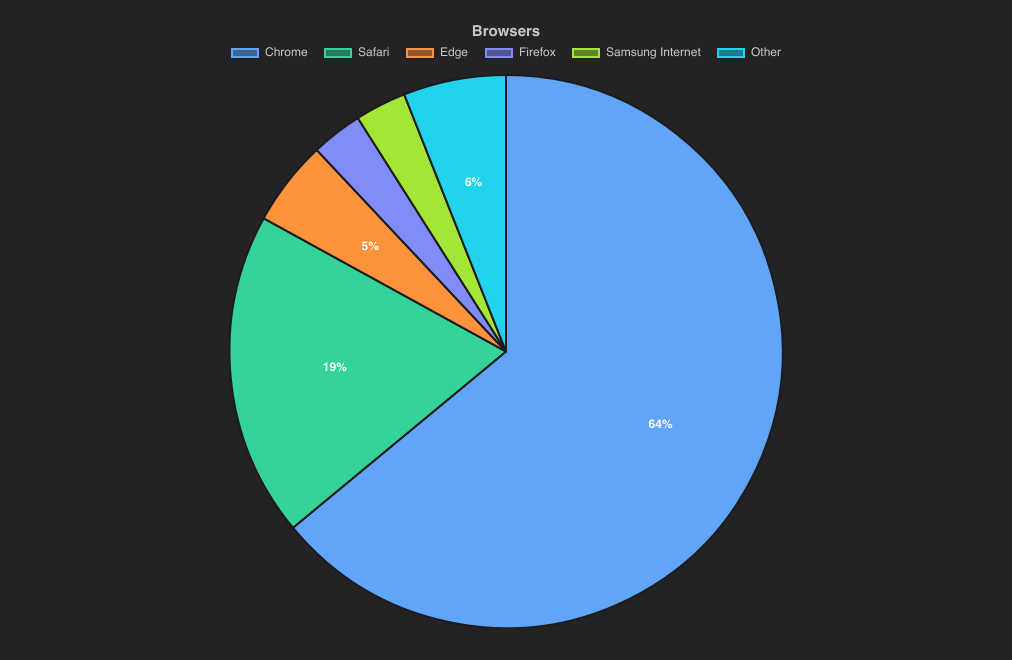
Slices proportional to their values. The hovered slice moves outwards, and the tooltip shows its value and share. Clicking a legend entry hides the slice.
import { PieChart } from "@slintplot";

PieChart {
    title: "Browsers";
    slices: [
        { label: "Chrome", value: 64 },
        { label: "Safari", value: 19 },
        { label: "Edge", value: 5 },
        { label: "Firefox", value: 3 },
        { label: "Samsung Internet", value: 3 },
        { label: "Other", value: 6, color: transparent, hidden: false },
    ];
    show-percentages: true;
}| Property | Type | Default | Description |
|---|---|---|---|
slices in-out | [ChartSlice] | One entry per slice: label, value, color, hidden. Slices of 0 or less are skipped. See Data types | |
title | string | "" | Shown above the chart |
cutout | float | 0 | The size of the center hole, as a share of the radius |
polar | bool | false | Equal angles, with the radius showing the value, as in a polar area chart |
show-values | bool | false | Write each value on its slice |
show-percentages | bool | false | Write each slice's share of the total on it |
show-legend | bool | true | A legend of the slices; clicking an entry hides or shows one |
legend-position | ChartLegendPosition | top | top, bottom, left or right |
legend-attached | bool | true | Keep the legend next to the chart, not at the edge of its area, when the chart leaves room around it; false for the edge |
show-tooltip | bool | true | A tooltip with the values under the mouse |
animated | bool | true | Grow the data in when the chart appears, and move to new values |
value-prefix | string | "" | Written before every value, such as $ |
value-suffix | string | "" | Written after every value, such as % |
value-decimals | int | -1 | Decimals of every value; -1 picks them from the data |
hovered-index out | int | The slice under the mouse or selected with the keyboard, or -1 | |
slice-clicked(index) | callback | A slice was clicked, or chosen with Enter | |
legend-toggled(index) | callback | A legend entry hid or showed a slice |
DoughnutChart
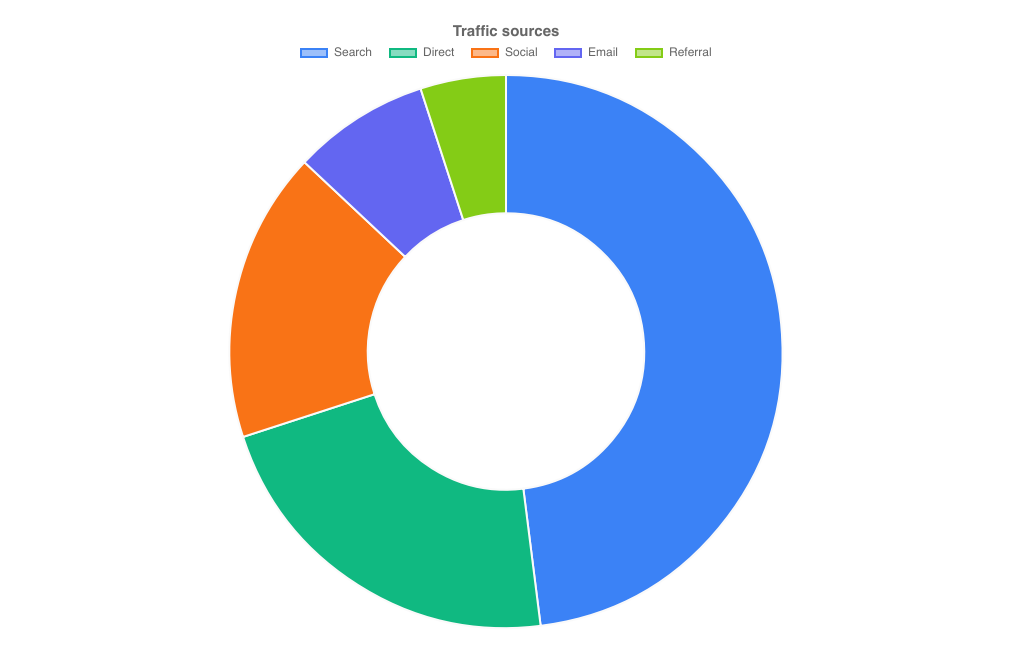
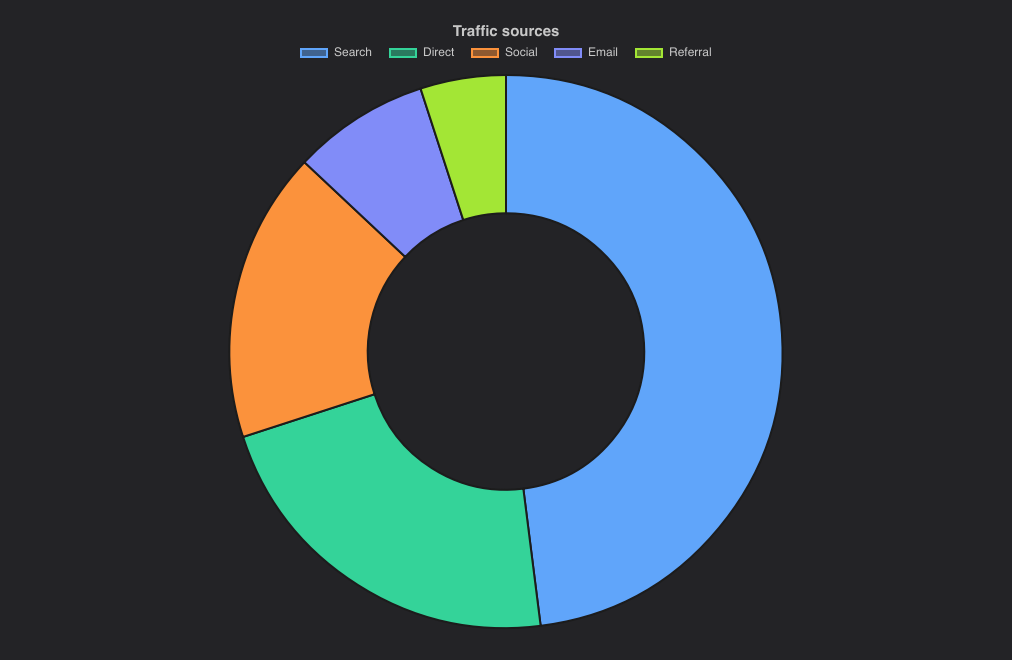
A PieChart with cutout: 0.5. It has the same properties.
import { DoughnutChart } from "@slintplot";

DoughnutChart {
    title: "Traffic sources";
    slices: [
        { label: "Search", value: 48 },
        { label: "Direct", value: 22 },
        { label: "Social", value: 17 },
        { label: "Email", value: 8 },
        { label: "Referral", value: 5 },
    ];
}| Property | Type | Default | Description |
|---|---|---|---|
slices in-out | [ChartSlice] | One entry per slice: label, value, color, hidden. Slices of 0 or less are skipped. See Data types | |
title | string | "" | Shown above the chart |
cutout | float | 0.5 | The size of the center hole, as a share of the radius |
polar | bool | false | Equal angles, with the radius showing the value, as in a polar area chart |
show-values | bool | false | Write each value on its slice |
show-percentages | bool | false | Write each slice's share of the total on it |
show-legend | bool | true | A legend of the slices; clicking an entry hides or shows one |
legend-position | ChartLegendPosition | top | top, bottom, left or right |
legend-attached | bool | true | Keep the legend next to the chart, not at the edge of its area, when the chart leaves room around it; false for the edge |
show-tooltip | bool | true | A tooltip with the values under the mouse |
animated | bool | true | Grow the data in when the chart appears, and move to new values |
value-prefix | string | "" | Written before every value, such as $ |
value-suffix | string | "" | Written after every value, such as % |
value-decimals | int | -1 | Decimals of every value; -1 picks them from the data |
hovered-index out | int | The slice under the mouse or selected with the keyboard, or -1 | |
slice-clicked(index) | callback | A slice was clicked, or chosen with Enter | |
legend-toggled(index) | callback | A legend entry hid or showed a slice |
PolarAreaChart
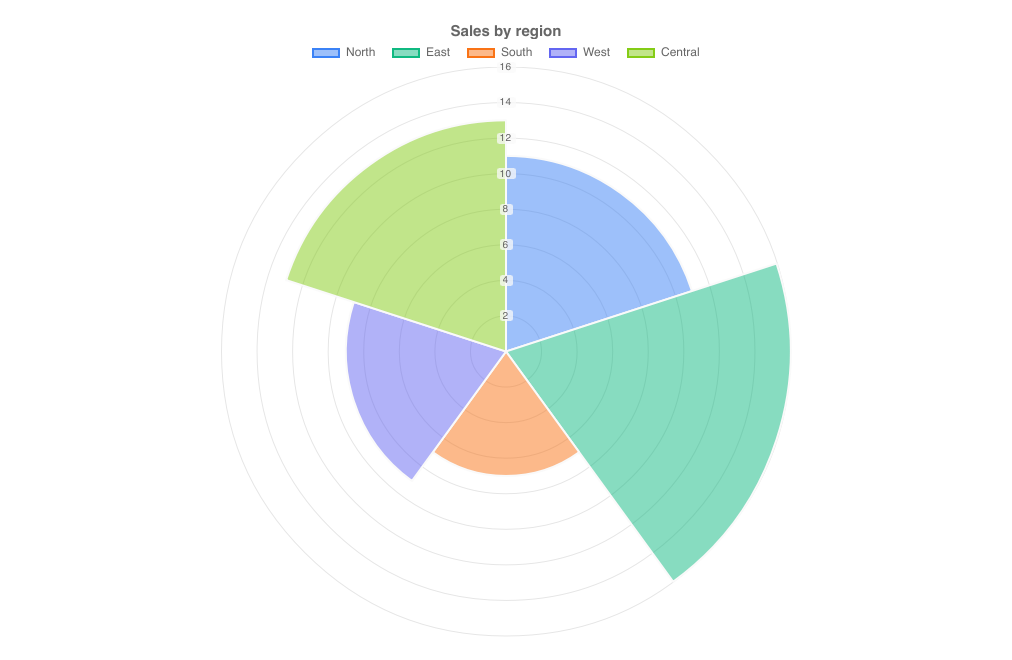
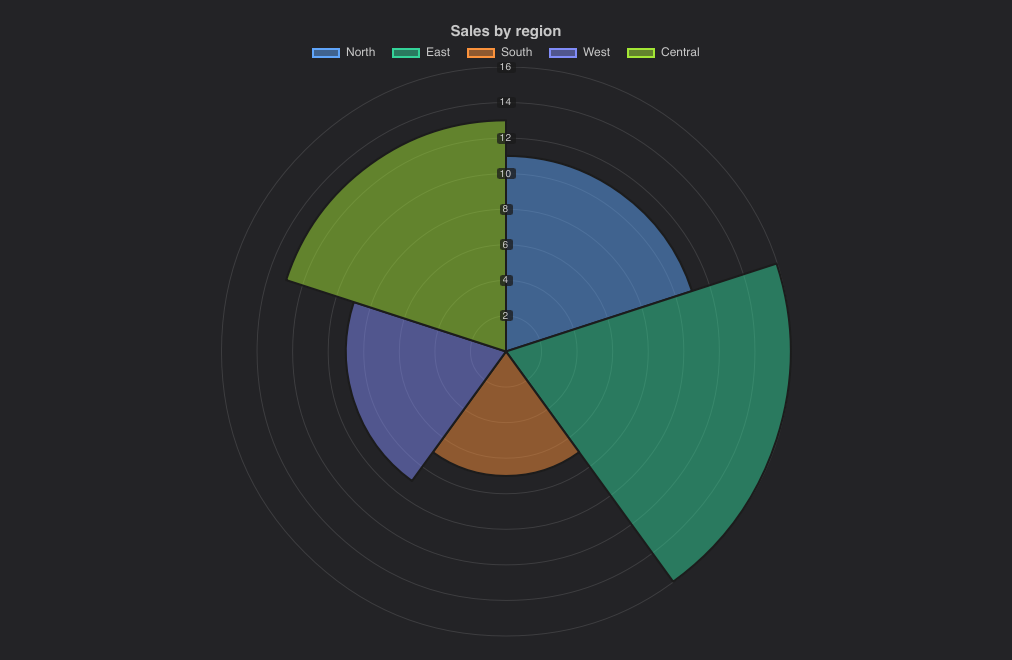
Slices of equal angle whose radius shows the value, with labelled value rings. It has the same properties as PieChart.
import { PolarAreaChart } from "@slintplot";

PolarAreaChart {
    title: "Sales by region";
    slices: [
        { label: "North", value: 11 },
        { label: "East", value: 16 },
        { label: "South", value: 7 },
        { label: "West", value: 9 },
        { label: "Central", value: 13 },
    ];
}| Property | Type | Default | Description |
|---|---|---|---|
slices in-out | [ChartSlice] | One entry per slice: label, value, color, hidden. Slices of 0 or less are skipped. See Data types | |
title | string | "" | Shown above the chart |
cutout | float | 0 | The size of the center hole, as a share of the radius |
polar | bool | true | Equal angles, with the radius showing the value, as in a polar area chart |
show-values | bool | false | Write each value on its slice |
show-percentages | bool | false | Write each slice's share of the total on it |
show-legend | bool | true | A legend of the slices; clicking an entry hides or shows one |
legend-position | ChartLegendPosition | top | top, bottom, left or right |
legend-attached | bool | true | Keep the legend next to the chart, not at the edge of its area, when the chart leaves room around it; false for the edge |
show-tooltip | bool | true | A tooltip with the values under the mouse |
animated | bool | true | Grow the data in when the chart appears, and move to new values |
value-prefix | string | "" | Written before every value, such as $ |
value-suffix | string | "" | Written after every value, such as % |
value-decimals | int | -1 | Decimals of every value; -1 picks them from the data |
hovered-index out | int | The slice under the mouse or selected with the keyboard, or -1 | |
slice-clicked(index) | callback | A slice was clicked, or chosen with Enter | |
legend-toggled(index) | callback | A legend entry hid or showed a slice |
RadarChart
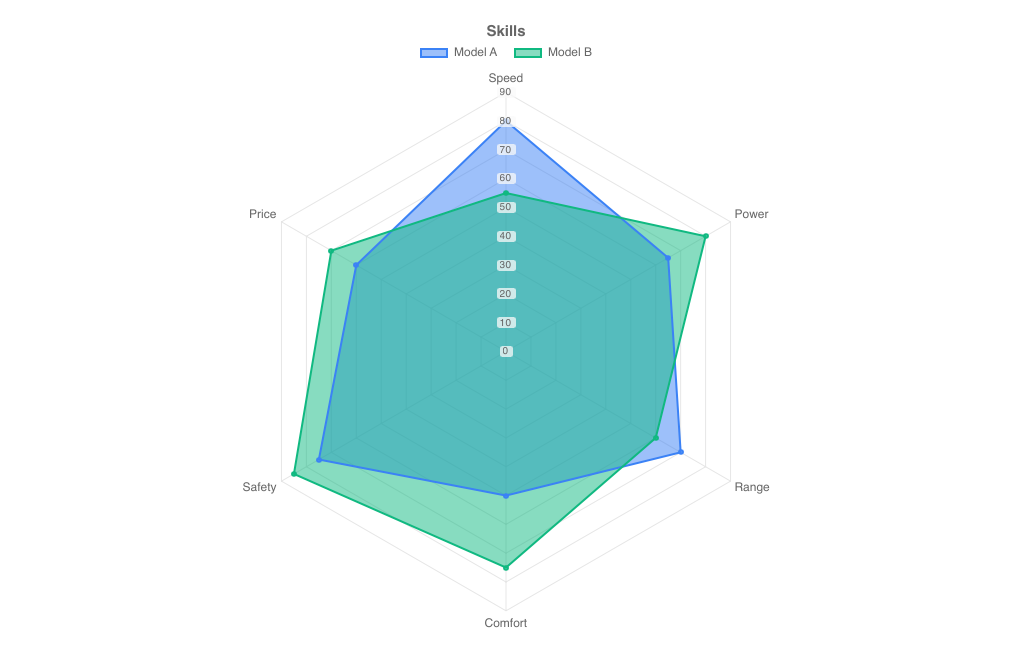
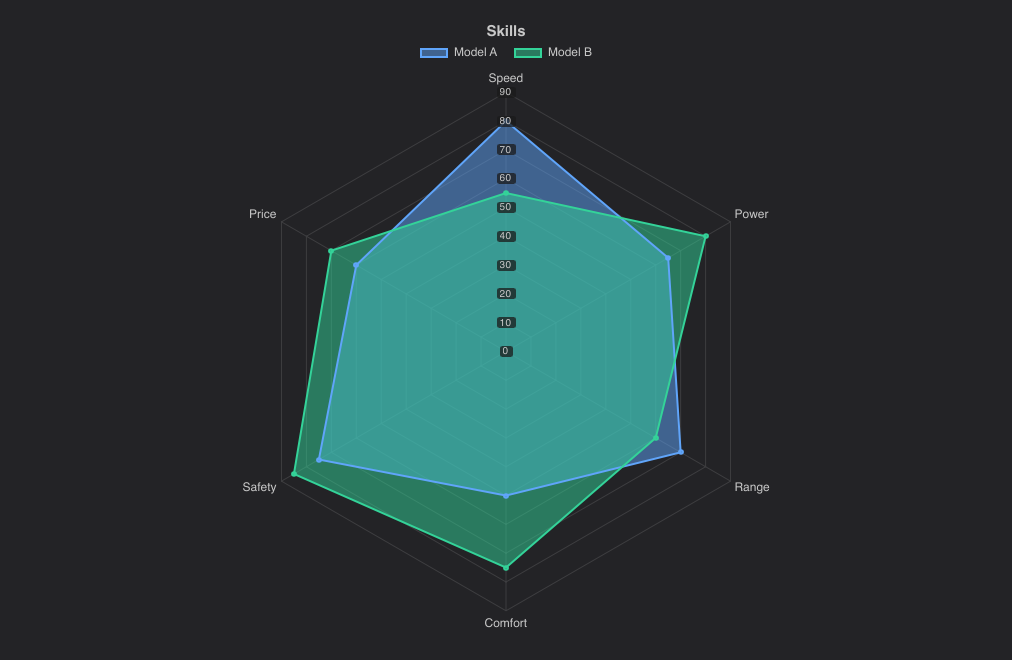
One spoke per label and one closed polygon per dataset. Hovering a spoke shows every dataset's value for it.
import { RadarChart } from "@slintplot";

RadarChart {
    title: "Skills";
    labels: ["Speed", "Power", "Range", "Comfort", "Safety", "Price"];
    datasets: [
        { label: "Model A", values: [80, 65, 70, 50, 75, 60], fill: true },
        { label: "Model B", values: [55, 80, 60, 75, 85, 70], fill: true },
    ];
}| Property | Type | Default | Description |
|---|---|---|---|
datasets in-out | [ChartDataset] | The data, one entry per dataset: label, values, color, hidden, fill. See ChartDataset | |
labels | [string] | One spoke per label; at least three | |
title | string | "" | Shown above the chart |
show-points | bool | true | A marker on every corner of the polygons |
show-legend | bool | true | A legend of the datasets; clicking an entry hides or shows one |
legend-position | ChartLegendPosition | top | top, bottom, left or right |
legend-attached | bool | true | Keep the legend next to the chart, not at the edge of its area, when the chart leaves room around it; false for the edge |
show-tooltip | bool | true | A tooltip with the values under the mouse |
animated | bool | true | Grow the data in when the chart appears, and move to new values |
begin-at-zero | bool | true | The center is 0 |
value-prefix | string | "" | Written before every value, such as $ |
value-suffix | string | "" | Written after every value, such as % |
value-decimals | int | -1 | Decimals of every value; -1 picks them from the data |
hovered-index out | int | The spoke under the mouse or selected with the keyboard, or -1 | |
category-clicked(index) | callback | A spoke was clicked, or chosen with Enter | |
legend-toggled(index) | callback | A legend entry hid or showed a dataset |
RadialBarChart
One ring per bar, the first outermost, each filled along its arc in proportion to its value over a faint gray track, like
activity rings and radial progress bars. A full ring is max-value, or the largest value when it is 0; larger values fill
the ring. The rings cover sweep degrees (270 by default) clockwise from start-angle, and each label goes in
the opening before the start of its ring. Each value is written just past the end of its bar, or inside the bar when it is nearly full.
The bars take the theme's colors in turn, or one color for all; a bar's own color overrides both. They grow in when the
chart appears and move to new values when a bar's value changes; change the bars' rows in place (set_row_data) rather than
replacing the model, so that each bar keeps its ring. Hovering a ring or its label shows its value. The bars are
ChartSlices, as in a pie chart, so the same data can be shown both ways.
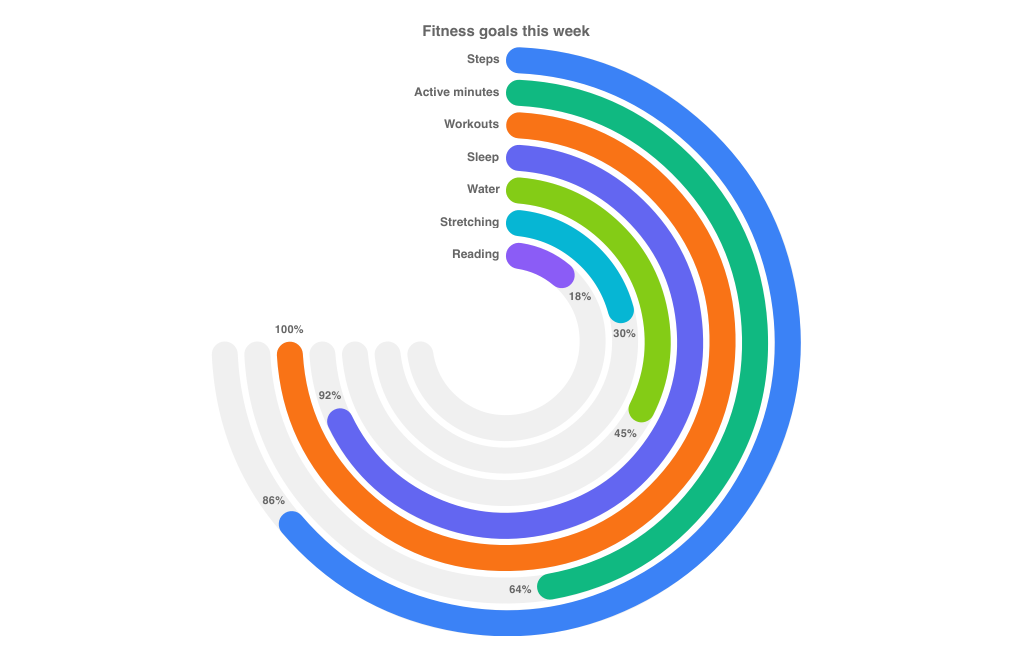
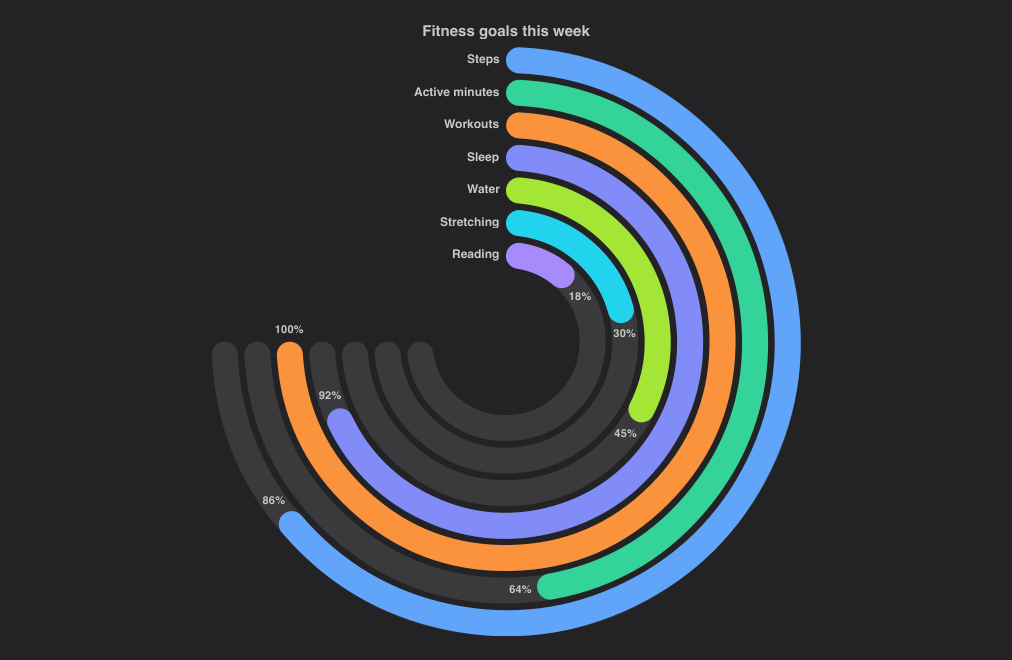
import { RadialBarChart } from "@slintplot";

RadialBarChart {
    title: "Fitness goals this week";
    bars: [
        { label: "Steps", value: 86 },
        { label: "Active minutes", value: 64 },
        { label: "Workouts", value: 100 },
        { label: "Sleep", value: 92 },
        { label: "Water", value: 45 },
        { label: "Stretching", value: 30 },
        { label: "Reading", value: 18 },
    ];
    max-value: 100;
    value-suffix: "%";
}| Property | Type | Default | Description |
|---|---|---|---|
bars in-out | [ChartSlice] | One entry per ring, from the outside in: label, value, color, hidden. Values of 0 or less, and missing ones, leave the ring empty. See Data types | |
title | string | "" | Shown above the chart |
max-value | float | 0 | The value of a full ring; 0 for the largest value |
start-angle | float | 0 | Where the rings start, in degrees clockwise from 12 o'clock |
sweep | float | 270 | The angle a full ring covers, in degrees; below 360 it leaves room for the labels |
cutout | float | 0.25 | The empty middle, as a share of the radius |
ring-gap | float | 0.25 | The gap between the rings, as a share of their width |
rounded | bool | true | Round ends on the bars and tracks |
color | color | unset | One color for every bar without its own; unset, the bars take ChartTheme.colors in turn |
show-labels | bool | true | Each bar's label before the start of its ring |
show-values | bool | true | Each value just past the end of its bar, or inside it; rings too thin for the text leave it out |
show-legend | bool | false | A legend of the bars; clicking an entry hides or shows one |
legend-position | ChartLegendPosition | bottom | top, bottom, left or right |
legend-attached | bool | true | Keep the legend next to the chart, not at the edge of its area, when the chart leaves room around it; false for the edge |
show-tooltip | bool | true | A tooltip with the value under the mouse |
animated | bool | true | Grow the bars in when the chart appears, and move them when the values change |
value-prefix | string | "" | Written before every value, such as $ |
value-suffix | string | "" | Written after every value, such as % |
value-decimals | int | -1 | Decimals of every value; -1 picks them from the data |
hovered-index out | int | The bar under the mouse or selected with the keyboard, or -1 | |
bar-clicked(index) | callback | A ring or its label was clicked, or the bar chosen with Enter | |
legend-toggled(index) | callback | A legend entry hid or showed a bar |
SegmentedRingChart
A heatmap bent into concentric rings. values is a matrix, [[float]]: each row is a ring, the first
outermost, and each column a segment of every ring, going round from start-angle, clockwise or not. The chart takes its
size from the matrix, as many rings as rows and as many segments as the longest row, and fits them to the space it has; shorter rows
leave the rest of their ring empty. Cells are colored on a scale, with the same properties as a HeatmapChart,
or by category: with classes set, each value is the index of its category, and the categories make the legend. Missing values (NaN),
and values that name no category such as -1, are left as a faint track. x-labels go round the outside, every second or third
one where they don't all fit, and y-labels name the rings in the tooltip. center-text and center-label
are written in the middle; hovering a cell shows it there instead.
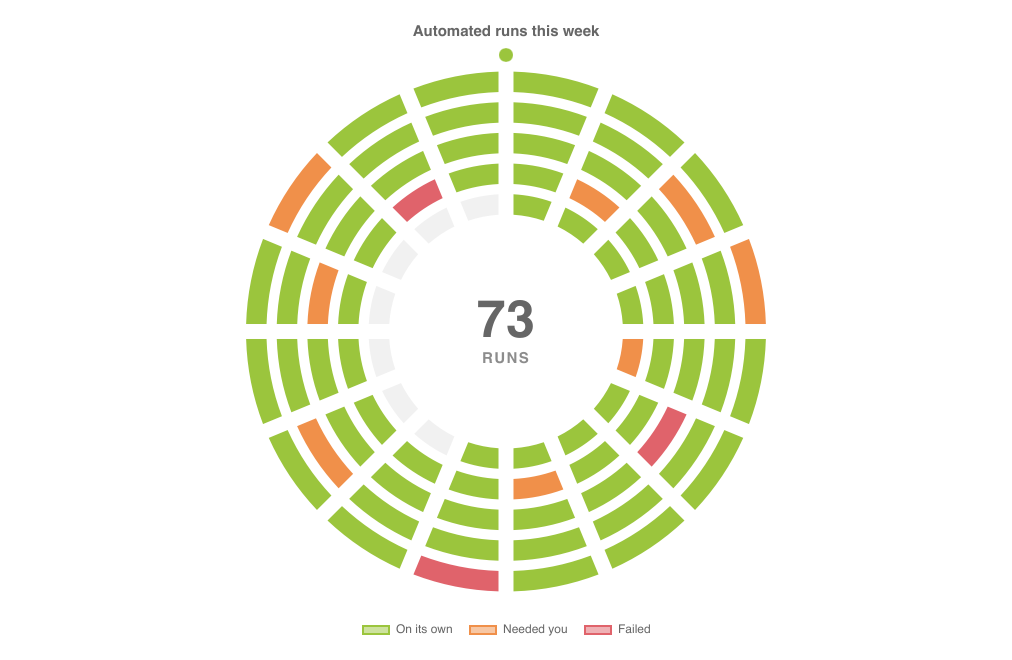
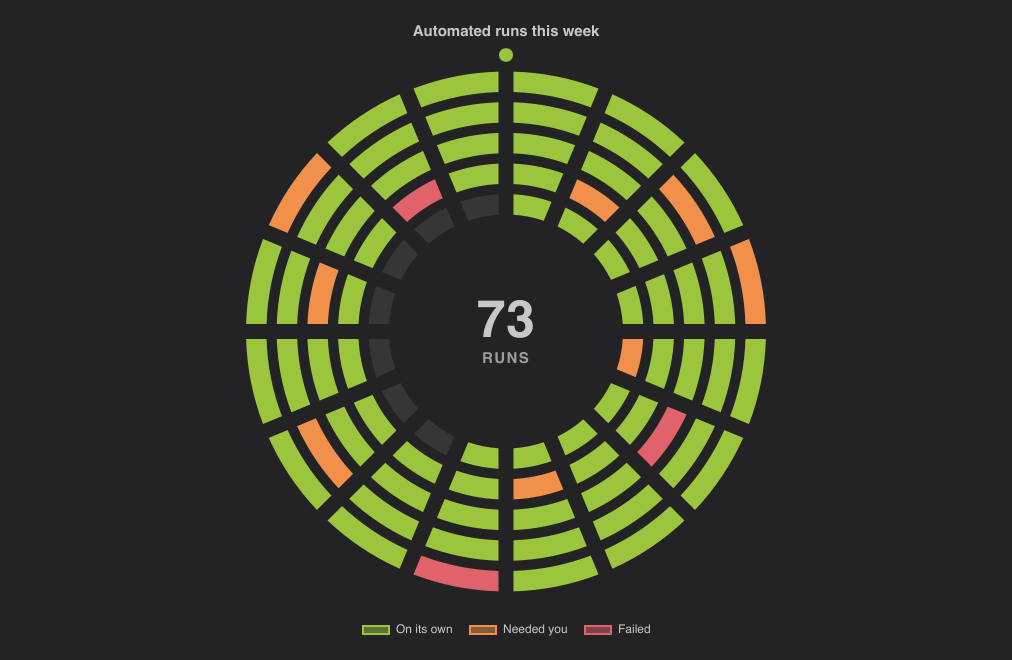
import { SegmentedRingChart } from "@slintplot";

SegmentedRingChart {
    title: "Automated runs this week";
    // One ring per day, the first outermost; one segment per run, every 90 minutes.
    // 0: on its own, 1: needed you, 2: failed, -1: not run yet.
    values: [
        [0, 0, 0, 1, 0, 0, 0, 0, 2, 0, 0, 0, 0, 1, 0, 0],
        [0, 0, 1, 0, 0, 0, 0, 0, 0, 0, 1, 0, 0, 0, 0, 0],
        [0, 0, 0, 0, 0, 2, 0, 0, 0, 0, 0, 0, 1, 0, 0, 0],
        [0, 1, 0, 0, 0, 0, 0, 1, 0, 0, 0, 0, 0, 0, 2, 0],
        [0, 0, 0, 0, 1, 0, 0, 0, 0, -1, -1, -1, -1, -1, -1, -1],
    ];
    y-labels: ["Mon", "Tue", "Wed", "Thu", "Fri"];
    classes: [
        { label: "On its own", color: #9bc53d },
        { label: "Needed you", color: #f0904a },
        { label: "Failed", color: #e0636b },
    ];
    show-labels: false;
    show-marker: true;
    center-text: "73";
    center-label: "RUNS";
}| Property | Type | Default | Description |
|---|---|---|---|
values | [[float]] | The matrix: one row per ring, from the outside in, and one value per segment. NaN is an empty segment | |
x-labels | [string] | [] | The columns' labels, round the outside |
y-labels | [string] | [] | The rows' labels, in the tooltip and the middle |
classes in-out | [ChartSlice] | [] | Color by category: a value is a category index, and each category has a label, color and hidden flag. Empty for a color scale |
title | string | "" | Shown above the chart |
color | color | first theme color | The scale's color for the largest value |
diverging, center-value, negative-color | bool, float, color | false, 0, third theme color | A diverging scale around center-value, as in a heatmap |
fixed-range, min-value, max-value | bool, float, float | false, 0, 100 | A fixed range for the scale instead of the data's |
start-angle | float | 0 | Where the first column starts, in degrees clockwise from 12 o'clock |
clockwise | bool | true | Which way the columns go |
cutout | float | 0.45 | The empty middle, as a share of the radius |
ring-gap | float | 0.5 | The gap between the rings, as a share of their width |
segment-gap | float | 0.3 | The gap between the segments, as a share of a segment of the inner ring. It is at least 2px, and as wide in every ring, so the gaps form straight spokes |
track-color | color | unset | The empty segments; unset for a faint gray |
show-labels | bool | true | The column labels round the outside |
show-center | bool | true | The text in the middle |
center-text, center-label | string | "" | The large text in the middle, and the caption under it |
show-marker | bool | false | A dot at the start, outside the outer ring |
glow | bool | false | A soft glow in the middle, of the first category's color or the scale's |
show-legend | bool | true | The categories, which hide and show on click, or the color scale |
legend-position | ChartLegendPosition | bottom | Where the categories' legend goes |
legend-attached | bool | true | Keep the legend next to the chart, not at the edge of its area, when the chart leaves room around it; false for the edge |
show-tooltip | bool | true | A tooltip with the cell under the mouse |
animated | bool | true | Sweep the cells in when the chart appears |
value-prefix, value-suffix, value-decimals | string, string, int | "", "", -1 | How values on a scale are written |
hovered-row, hovered-column out | int | The cell under the mouse or selected with the keyboard, or -1 | |
cell-clicked(row, column) | callback | A cell was clicked, or chosen with Enter | |
legend-toggled(index) | callback | A legend entry hid or showed a category |
How the matrix becomes rings
- Rows are rings.
values[0]is the outer ring,values[1]the next one in, and so on. A matrix with one row is a single ring. - Columns are segments. Column 0 starts at
start-angle(12 o'clock by default), and the columns go round clockwise, or counterclockwise withclockwise: false. Every ring has as many segments as the longest row has values, so the same column lines up on every ring, like a clock face: hours, days of a month, steps of a process. - The size is automatic. There is nothing to set when the matrix grows or shrinks: the ring width, the segment angle and the spacing of the labels follow the data and the size of the chart. Few rings stay narrow at the outside rather than filling the whole radius.
- Rows can differ in length. A shorter row leaves the rest of its ring empty, as in a year with one ring per month of 28 to 31 days, or today's row of a week that is not over yet.
- Empty cells. NaN (
0 / 0in Slint), and withclassesany value that names no class, such as -1, is drawn as the faint track, so the shape of the whole matrix stays visible. - Limits. Up to 50 rings and 720 segments per ring are drawn; the rest of a larger matrix is left out.
By category, or on a scale
With classes set, each value is a category index, rounded: 0 is the first category, 1 the second, and so on. Each category is a
ChartSlice with a label and a color (unset, it takes the theme's next color), and the categories make the legend;
clicking an entry hides that category, leaving its cells empty. This suits states and outcomes: passed and failed, up and down, done and
skipped. Without categories, the values are colored on a scale, exactly as in a HeatmapChart: from a faint
color for the smallest value to the full color for the largest, or with diverging, from
negative-color below center-value to color above it. The scale fits the data unless
fixed-range is set; the legend under the chart shows it.
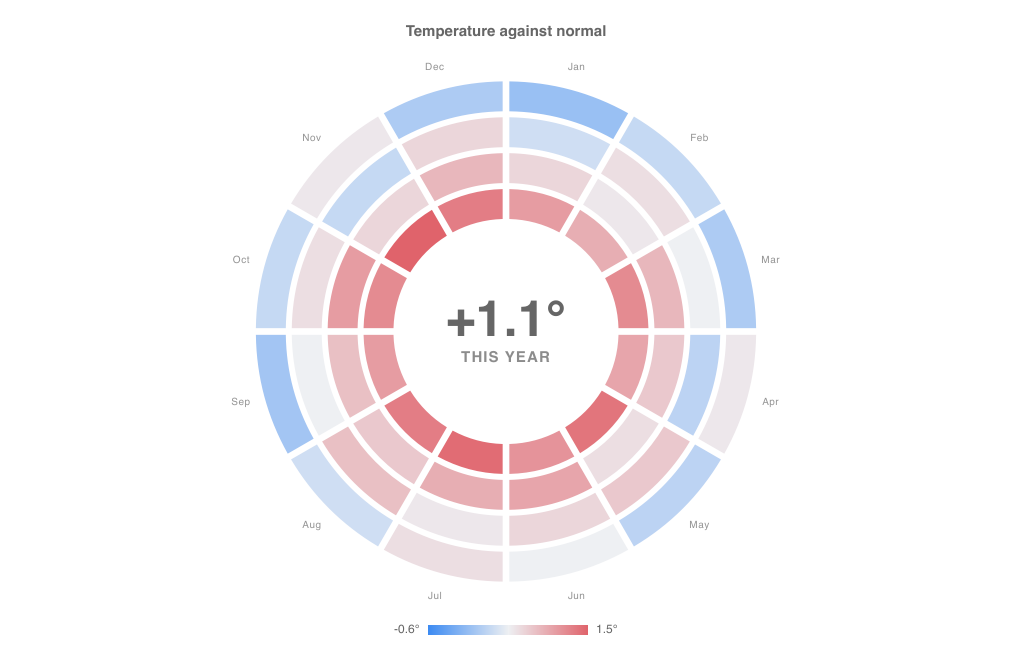
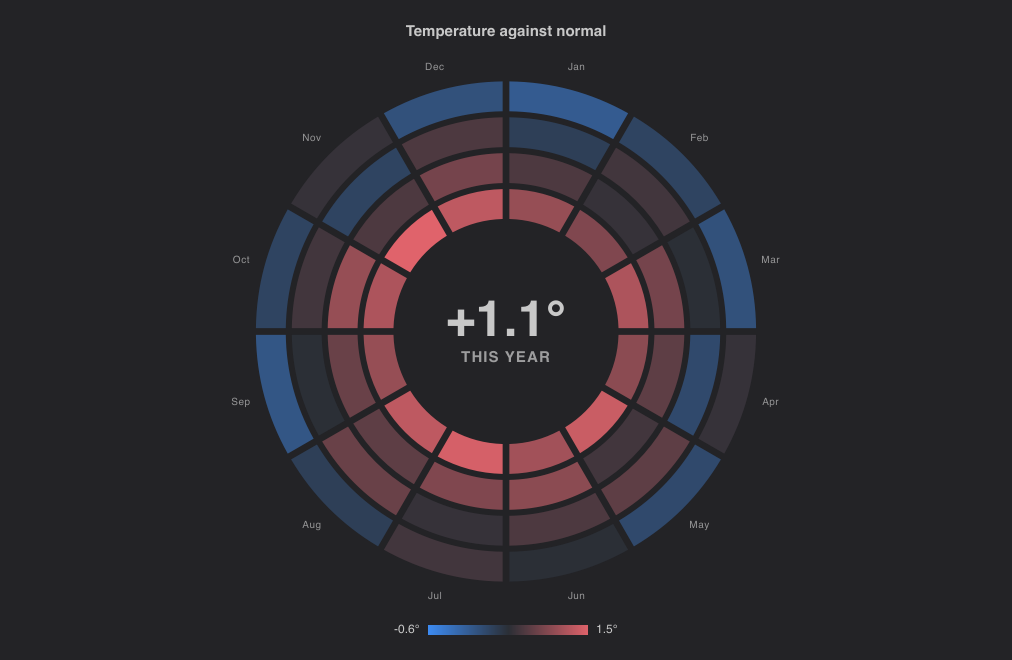
import { SegmentedRingChart } from "@slintplot";

SegmentedRingChart {
    title: "Temperature against normal";
    // One ring per year, the oldest outermost; one segment per month.
    values: [
        [-0.6, -0.2, -0.4, 0.1, -0.3, 0.0, 0.2, -0.1, -0.5, -0.2, 0.1, -0.4],
        [-0.1, 0.2, 0.0, -0.3, 0.4, 0.3, 0.1, 0.5, 0.0, 0.2, -0.2, 0.3],
        [0.3, 0.1, 0.6, 0.4, 0.2, 0.8, 0.7, 0.4, 0.5, 0.9, 0.3, 0.6],
        [0.9, 0.7, 1.1, 0.8, 1.3, 1.0, 1.4, 1.2, 0.9, 1.1, 1.5, 1.2],
    ];
    x-labels: ["Jan", "Feb", "Mar", "Apr", "May", "Jun", "Jul", "Aug", "Sep", "Oct", "Nov", "Dec"];
    y-labels: ["2022", "2023", "2024", "2025"];
    diverging: true;
    color: #e0636b;
    negative-color: #3d8bf2;
    segment-gap: 0.1;
    ring-gap: 0.2;
    value-suffix: "°";
    value-decimals: 1;
    center-text: "+1.1°";
    center-label: "THIS YEAR";
}
The matrix from Rust
A [[float]] property is a model of models in Rust: ModelRc<ModelRc<f32>>. Keep a
VecModel per row to change single cells, and one for the rows to add or remove rings; the chart redraws when any of them
changes, and takes the new size when rows or columns are added.
// ui/app.slint
import { ChartEngine, SegmentedRingChart } from "@slintplot";
export { ChartEngine } // required, so Rust can connect it

export component App inherits Window {
    in property <[[float]]> runs;
    in property <[string]> days;
    SegmentedRingChart {
        values: root.runs;
        y-labels: root.days;
        classes: [{ label: "Passed" }, { label: "Failed" }];
        show-labels: false;
    }
}
// src/main.rs
use std::rc::Rc;
use slint::{Model, ModelRc, VecModel};
slint::include_modules!();
fn main() -> Result<(), slint::PlatformError> {
let app = App::new()?;
slintplot::register!(app);
// One row per day, 24 runs a day; NaN for runs still to come.
let today = Rc::new(VecModel::from(vec![f32::NAN; 24]));
let rows: Rc<VecModel<ModelRc<f32>>> = Rc::new(VecModel::from(vec![
ModelRc::new(VecModel::from(vec![0.0; 24])), // yesterday: all passed
ModelRc::from(today.clone()),
]));
app.set_runs(rows.clone().into());
app.set_days(ModelRc::new(VecModel::from(vec!["Mon".into(), "Tue".into()])));
// Later: a run finished at 09:00 and failed, so one cell changes.
today.set_row_data(9, 1.0);
// A new day is a new ring; the chart makes room for it.
rows.push(ModelRc::new(VecModel::from(vec![f32::NAN; 24])));
app.run()
}Reacting to the chart
Hovering a cell outlines it and writes its value, or its category, in the middle with the row and column labels; a tooltip says the
same. hovered-row and hovered-column tell your code which cell that is, and cell-clicked(row, column)
reports clicks and Enter. The keyboard works too: click or tab to the chart, then Left and Right go round a ring, Up and Down move between
rings, and Home and End go to the first and last cell.
chart := SegmentedRingChart {
    values: root.runs;
    y-labels: root.days;
    x-labels: root.hours;
    cell-clicked(row, column) => {
        root.open-run(row, column);   // a callback of your own
    }
}
Text {
    text: chart.hovered-row < 0 ? "Hover a run" : "Run " + chart.hovered-column + " on day " + chart.hovered-row;
}
Tips
- Many columns: labels round the outside are thinned to every second, third, ... one that fits; with dozens of columns,
such as minutes or runs,
show-labels: falsegives the rings the room, and the tooltip still names each cell. - Many rings: lower
cutout(such as 0.3) for wider rings, orring-gapfor less space between them. - Big segments, such as one ring of steps: a larger
cutout(0.6) leaves room for a large number in the middle, and a smallersegment-gapjoins the segments into a ring. - The middle:
center-textis yours to fill, such as a count, a total or a percentage worked out with the data; leave it andcenter-labelempty for no text until a cell is hovered. - A start mark:
show-marker: trueputs a dot atstart-angle, which helps when the columns run counterclockwise or don't start at 12 o'clock.
Mixed charts
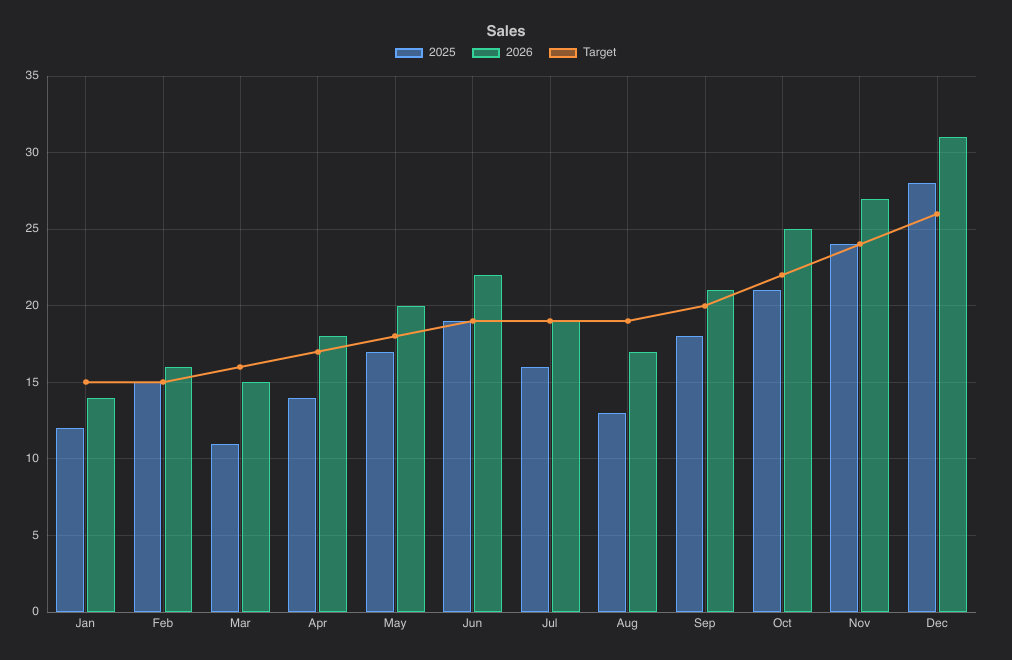
Any dataset in a line or bar chart can be drawn as the other type with series-type. Lines in a bar chart go through the bar centers, and stacking keeps lines and bars apart.
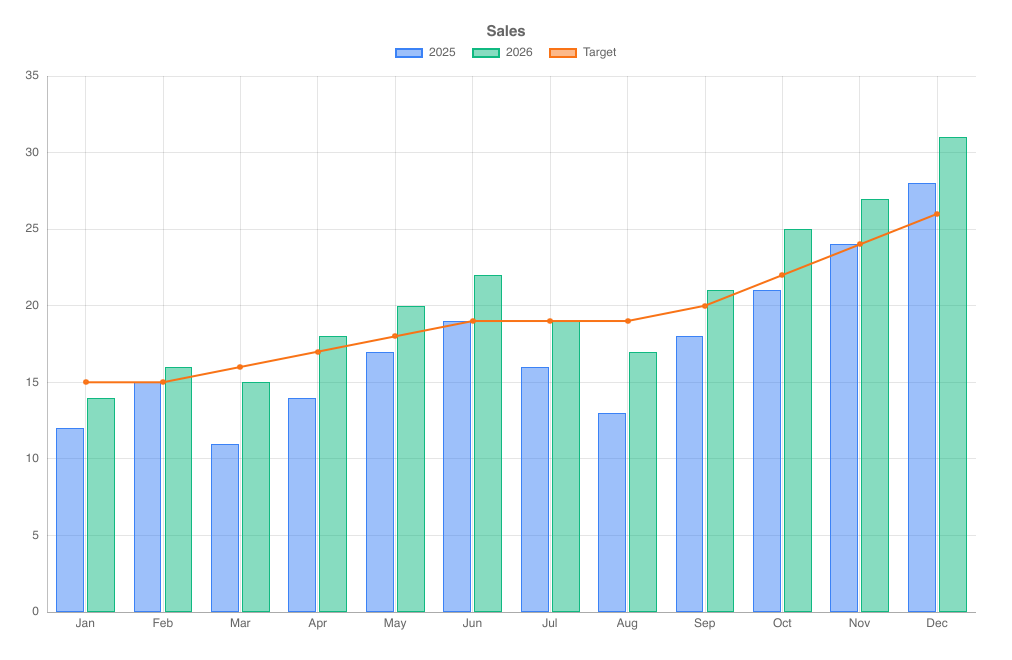
import { BarChart, ChartSeriesType } from "@slintplot";

BarChart {
    title: "Sales";
    labels: ["Jan", "Feb", "Mar", "Apr", "May", "Jun", "Jul", "Aug", "Sep", "Oct", "Nov", "Dec"];
    datasets: [
        { label: "2025", values: [12, 15, 11, 14, 17, 19, 16, 13, 18, 21, 24, 28] },
        { label: "2026", values: [14, 16, 15, 18, 20, 22, 19, 17, 21, 25, 27, 31] },
        { label: "Target", values: [15, 15, 16, 17, 18, 19, 19, 19, 20, 22, 24, 26], series-type: ChartSeriesType.line },
    ];
}
100% stacked bars
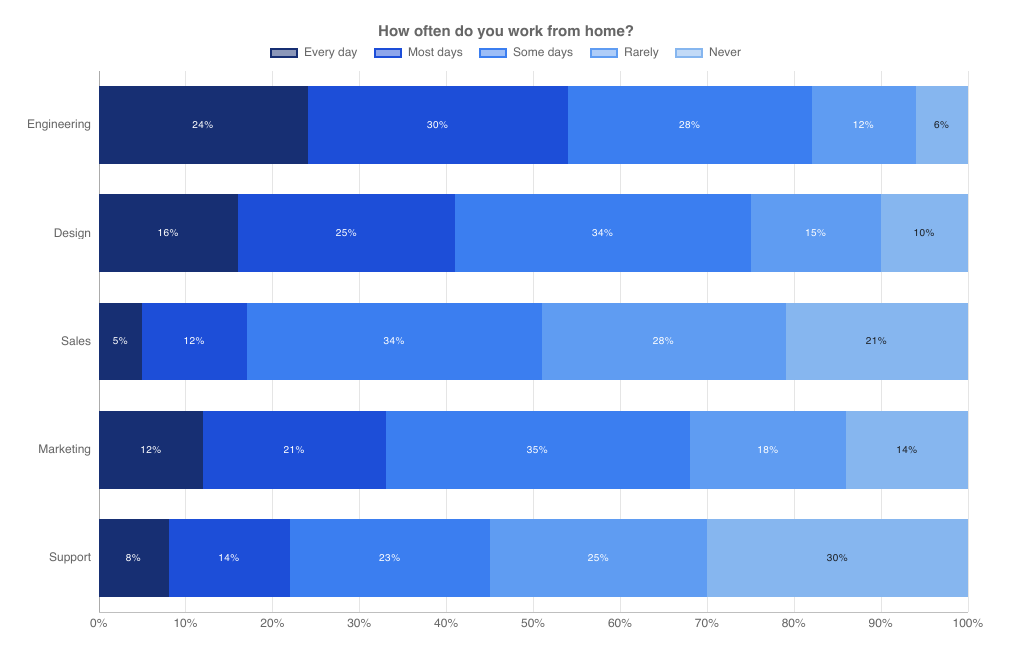
With stacked-percent: true, each category of a BarChart or HorizontalBarChart is split into the
datasets' shares, so every bar fills the axis from 0% to 100%. Labels and tooltips show the percentages. This is the classic chart for
survey answers. The percentage labels use largest remainder rounding, so each bar's labels add up to exactly 100%.
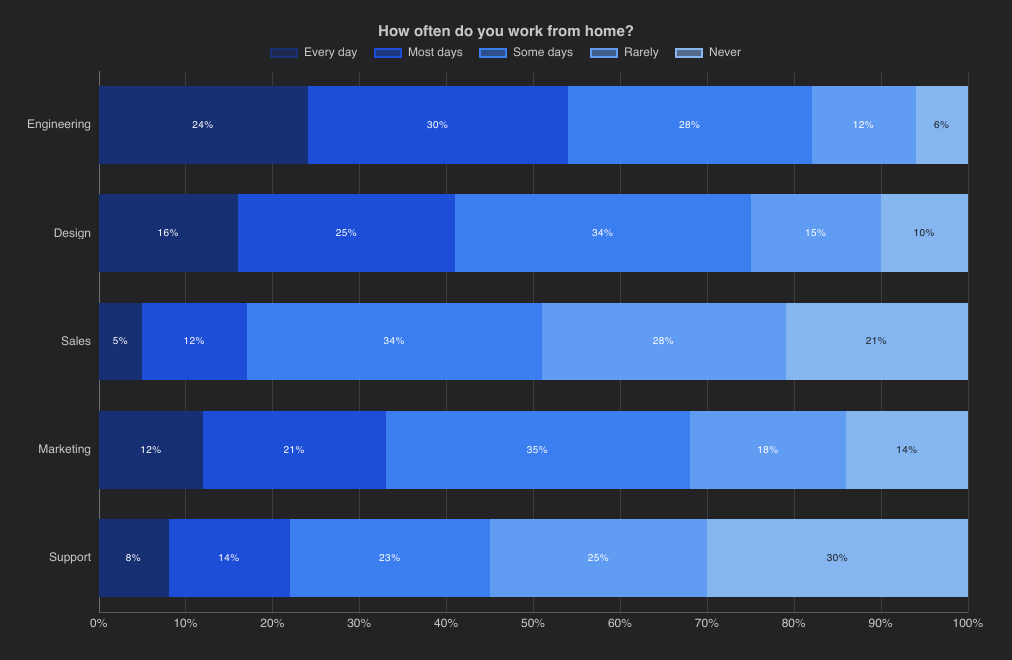
Answers with a natural order, from "Every day" to "Never", read best in shades of one color, as in the screenshot and the example
below: a fade from dark blue to light blue. Give each dataset its own color, which always wins over the theme; without one,
the datasets take the theme's colors.
import { HorizontalBarChart } from "@slintplot";

HorizontalBarChart {
    title: "How often do you work from home?";
    labels: ["Engineering", "Design", "Sales", "Marketing", "Support"];
    datasets: [
        { label: "Every day", values: [24, 16, 5, 12, 8], color: #172f73 },
        { label: "Most days", values: [30, 25, 12, 21, 14], color: #1d4ed8 },
        { label: "Some days", values: [28, 34, 34, 35, 23], color: #3b7ef0 },
        { label: "Rarely", values: [12, 15, 28, 18, 25], color: #5f9cf2 },
        { label: "Never", values: [6, 10, 21, 14, 30], color: #86b6ef },
    ];
    show-values: true;
    fill-opacity: 1;
    bar-border-width: 0;
    stacked-percent: true;
}
TimeSeriesChart
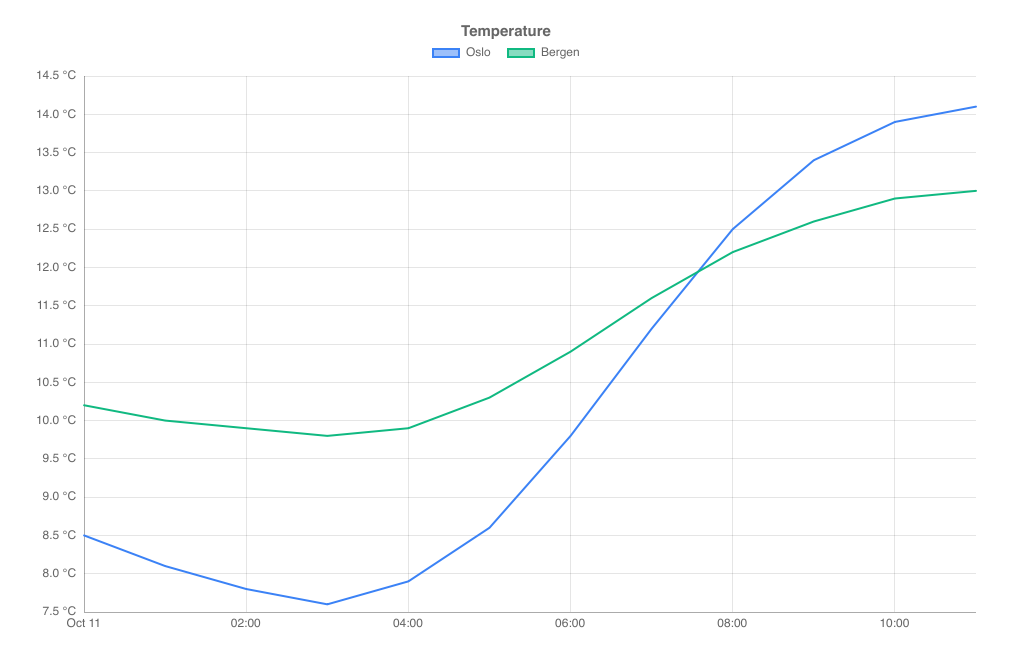
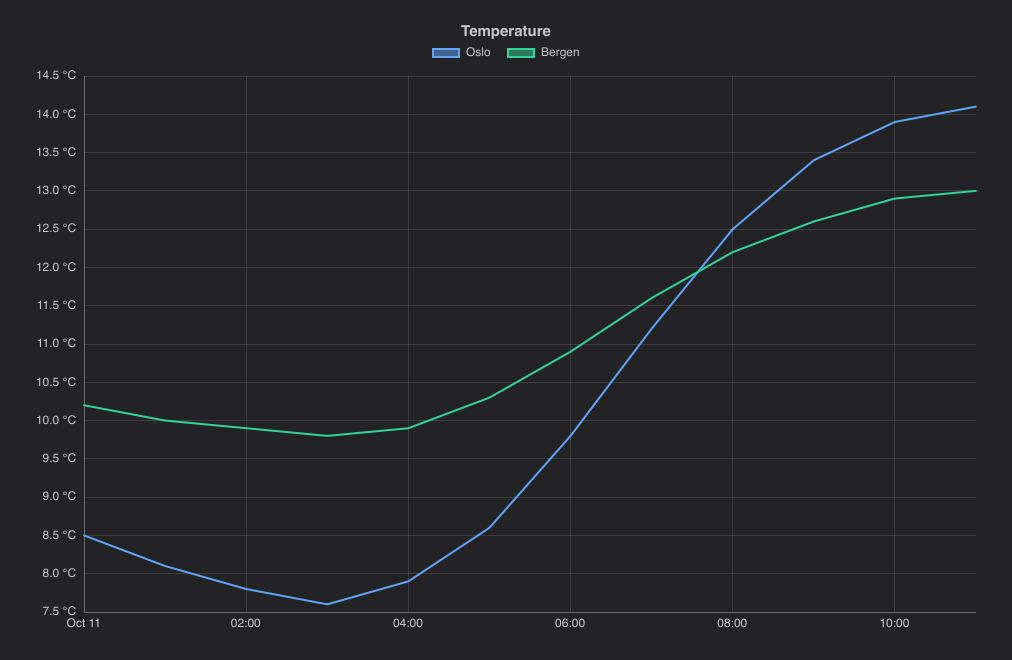
Lines over a time axis. Datasets use points, whose x is the number of seconds after time-origin.
The axis picks round times for its ticks: seconds, minutes, hours, days, months or years, depending on the visible range, and the
tooltip shows the date and time. Hovering anywhere above or below the lines shows the values at that time. Tick steps follow the visible span, from years down to seconds. When no tick falls on a midnight (or on a January), the first
tick also shows the date (or the year), so a zoomed-in axis always says when it is. Zoomed in between points, lines continue to the
edges of the plot.
import { TimeSeriesChart } from "@slintplot";

TimeSeriesChart {
    title: "Temperature";
    datasets: [
        {  // One point per hour: x is seconds after the time origin.
            label: "Oslo",
            points: [{ x: 0, y: 8.5 },       { x: 3600, y: 8.1 },    { x: 7200, y: 7.8 },    { x: 10800, y: 7.6 },
                     { x: 14400, y: 7.9 },   { x: 18000, y: 8.6 },   { x: 21600, y: 9.8 },   { x: 25200, y: 11.2 },
                     { x: 28800, y: 12.5 },  { x: 32400, y: 13.4 },  { x: 36000, y: 13.9 },  { x: 39600, y: 14.1 }],
        },
        {
            label: "Bergen",
            points: [{ x: 0, y: 10.2 },      { x: 3600, y: 10.0 },   { x: 7200, y: 9.9 },    { x: 10800, y: 9.8 },
                     { x: 14400, y: 9.9 },   { x: 18000, y: 10.3 },  { x: 21600, y: 10.9 },  { x: 25200, y: 11.6 },
                     { x: 28800, y: 12.2 },  { x: 32400, y: 12.6 },  { x: 36000, y: 12.9 },  { x: 39600, y: 13.0 }],
        },
    ];
    value-suffix: " °C";
    time-origin: { year: 2026, month: 10, day: 11 };
    zoom-enabled: true;
}| Property | Type | Default | Description |
|---|---|---|---|
datasets in-out | [ChartDataset] | The data, one entry per dataset: label, points, color, hidden, right-axis. See ChartDataset. Each point is { x, y }, with x in seconds after time-origin; points must be sorted by x | |
time-origin | ChartDateTime | 1970-01-01 | The time of x: 0, in UTC |
utc-offset | int | 0 | Minutes added to UTC for the times on the axis and in the tooltip, such as 120 |
title | string | "" | Shown above the chart |
show-lines | bool | true | Lines through the points |
show-points | bool | false | A marker on every point |
show-values | bool | false | Write each value by its point |
show-legend | bool | true | A legend of the datasets; clicking an entry hides or shows one |
legend-position | ChartLegendPosition | top | top, bottom, left or right |
show-tooltip | bool | true | A tooltip with the values under the mouse |
animated | bool | true | Grow the data in when the chart appears, and move to new values |
begin-at-zero | bool | false | Include 0 in the value axis |
x-title | string | "" | The title of the horizontal axis |
y-title | string | "" | The title of the vertical axis |
fixed-range | bool | false | Use min-value and max-value instead of fitting the value axis to the data |
min-value | float | 0 | The start of the value axis, with fixed-range |
max-value | float | 100 | The end of the value axis, with fixed-range |
integer-ticks | bool | false | Count in whole numbers: the value axis steps by at least 1, for values that are counted (people, items), where a short range otherwise gets ticks at 0.5 or 0.2 |
logarithmic | bool | false | A logarithmic value axis, for values that span several powers of ten |
value-prefix | string | "" | Written before every value, such as $ |
value-suffix | string | "" | Written after every value, such as % |
value-decimals | int | -1 | Decimals of every value; -1 picks them from the data |
y2-title, y2-begin-at-zero, y2-fixed-range, y2-min-value, y2-max-value, y2-logarithmic, y2-value-prefix, y2-value-suffix, y2-value-decimals | as without y2- | The second value axis, on the right, for datasets with right-axis: true. See A second value axis | |
decimate | bool | true | Draw a line with more points than pixels as one span per pixel column; turn off to draw every point |
zoom-enabled | bool | false | The mouse wheel zooms the x axis around the mouse, dragging pans, and a double-click resets |
view-start in-out | float | 0 | The start of the visible part of the x axis, from 0 to 1; set it to zoom from code |
view-end in-out | float | 1 | The end of the visible part of the x axis, from 0 to 1 |
min-view | float | 0.0005 | The smallest part of the x axis a zoom can show |
zoomed out | bool | Whether the chart is zoomed in | |
hovered-point out | ChartHit | The point under the mouse or selected with the keyboard; its dataset is -1 when there is none | |
point-clicked(dataset, index) | callback | A point was clicked, or chosen with Enter | |
legend-toggled(index) | callback | A legend entry hid or showed a dataset |
All cartesian properties apply as well, including decimate and zoom-enabled.
ScatterChart has the same time-axis, time-origin and show-lines properties.
x values are 32-bit floats: measured from a nearby origin, they stay exact to the second for about half a year.
GanttChart
One row per task, with a bar from its start to its end on a time axis like the time series': task times are seconds after
time-origin, and the ticks fall on round hours, days, weeks or months. Tasks with the same group are placed
together under the group's heading and share the group's color. A task's progress fills
that share of its bar; a task that ends where it starts is a milestone, drawn as a diamond: filled once reached (progress: 1), an outline before. show-now draws a line at
now, such as today. Labels too long for the left column are cut short with an ellipsis. Rows share the height, within
min-row-height and max-row-height; when they don't fit, the wheel or a drag scrolls them, and only the rows in
view are laid out, so plans of thousands of tasks stay fast. The tooltip shows the task's dates, duration and progress.
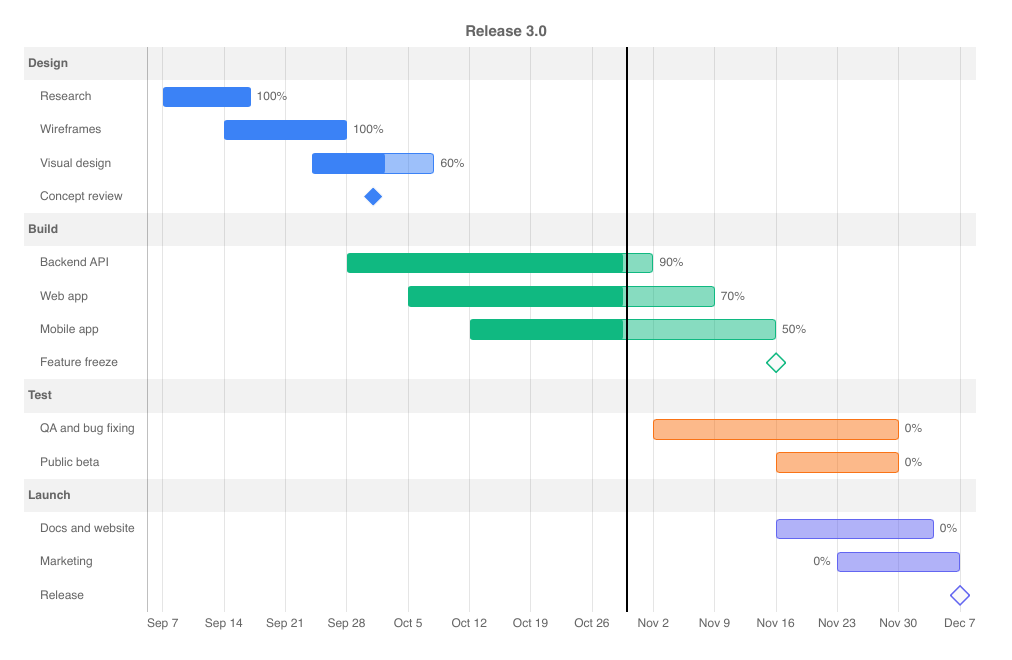
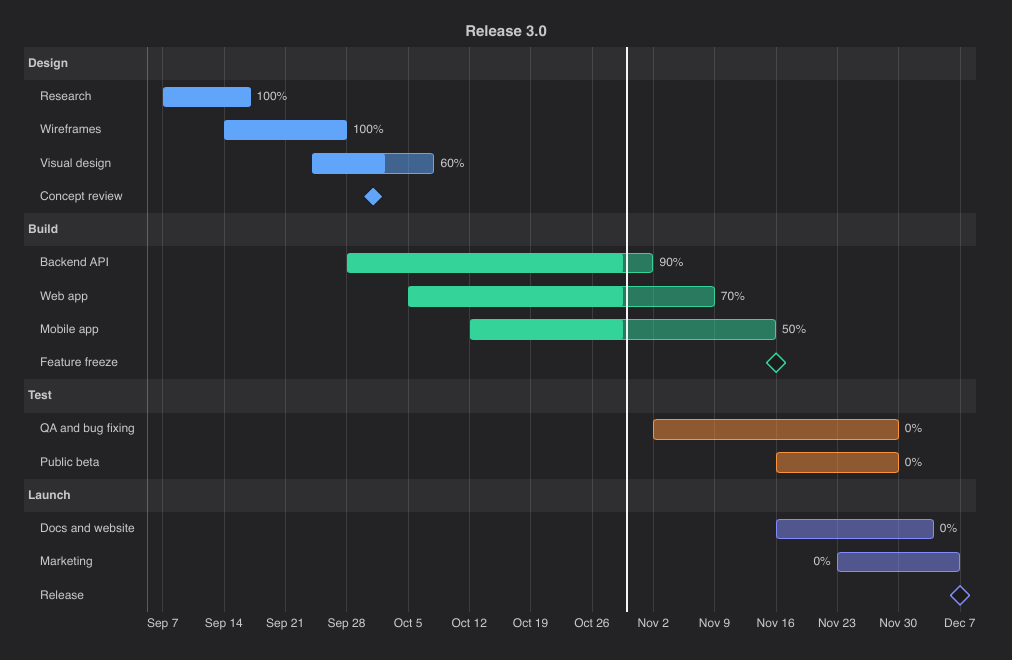
import { GanttChart } from "@slintplot";

GanttChart {
    property <float> day: 86400;  // Task times are seconds after the time origin.
    title: "Release 3.0";
    time-origin: { year: 2026, month: 9, day: 7 };
    tasks: [
        { label: "Research", group: "Design", start: 0, end: 10 * day, progress: 1 },
        { label: "Wireframes", group: "Design", start: 7 * day, end: 21 * day, progress: 1 },
        { label: "Visual design", group: "Design", start: 17 * day, end: 31 * day, progress: 0.6 },
        { label: "Concept review", group: "Design", start: 24 * day, end: 24 * day, progress: 1 },  // Reached
        { label: "Backend API", group: "Build", start: 21 * day, end: 56 * day, progress: 0.9 },
        { label: "Web app", group: "Build", start: 28 * day, end: 63 * day, progress: 0.7 },
        { label: "Mobile app", group: "Build", start: 35 * day, end: 70 * day, progress: 0.5 },
        { label: "Feature freeze", group: "Build", start: 70 * day, end: 70 * day },  // Ahead
        { label: "QA and bug fixing", group: "Test", start: 56 * day, end: 84 * day },
        { label: "Public beta", group: "Test", start: 70 * day, end: 84 * day },
        { label: "Docs and website", group: "Launch", start: 70 * day, end: 88 * day },
        { label: "Marketing", group: "Launch", start: 77 * day, end: 91 * day },
        { label: "Release", group: "Launch", start: 91 * day, end: 91 * day },
    ];
    show-now: true;
    now: 53 * day;
    show-values: true;
    zoom-enabled: true;
}| Property | Type | Default | Description |
|---|---|---|---|
tasks | [ChartGanttTask] | One entry per task: label, start, end, group, color, progress. See ChartGanttTask | |
time-origin | ChartDateTime | 1970-01-01 | The time of start: 0, in UTC |
utc-offset | int | 0 | Minutes added to UTC for the times on the axis and in the tooltip, such as 120 |
title | string | "" | Shown above the chart |
show-now | bool | false | A vertical line at now, when it is in view |
now | float | 0 | The time of the line, in seconds after time-origin |
now-color | color | black, white in dark mode | The color of the line |
show-values | bool | false | Write each task's progress after its bar |
show-tooltip | bool | true | A tooltip with the task's dates, duration and progress |
animated | bool | true | Grow the bars in when the chart appears |
fill-opacity | float | theme's | The opacity of the part of a bar not yet done; the part done is solid |
bar-radius | length | 3px | Rounded corners |
min-row-height | length | 20px | The smallest height of a row; rows that don't fit scroll |
max-row-height | length | 40px | The largest height of a row, for plans with few tasks |
x-title | string | "" | The title of the time axis |
zoom-enabled | bool | false | The mouse wheel zooms the time axis around the mouse, dragging pans, and a double-click resets. Shift and the wheel scroll the rows |
view-start in-out | float | 0 | The start of the visible part of the time axis, from 0 to 1; set it to zoom from code |
view-end in-out | float | 1 | The end of the visible part of the time axis, from 0 to 1 |
min-view | float | 0.001 | The smallest part of the time axis a zoom can show |
zoomed out | bool | Whether the chart is zoomed in | |
scroll-y in-out | length | 0 | How far the rows are scrolled up, when they don't fit |
hovered-index out | int | The task under the mouse or selected with the keyboard, or -1 | |
task-clicked(index) | callback | A task's bar or label was clicked, or the task chosen with Enter; index is its place in tasks | |
reset-zoom() | function | Shows the whole time axis again |
The time axis spans all tasks, with a little room at both ends. The up and down arrow keys move through the tasks, scrolling them
into view, and with zoom-enabled the left and right arrows pan. A task whose end is before its
start runs from the earlier time to the later, and a task with one missing time is a milestone at the other.
CandlestickChart
Prices over a time axis: for each period, a body from the open to the close, green when the price rose and red when it fell, and
a wick from the low to the high. With ohlc: true, each period is a bar from the low to the high with a tick to the left at
the open and one to the right at the close. x is the number of seconds after time-origin, ticks fall on round
times, and the chart zooms and pans like TimeSeriesChart. The value axis fits the candles in view.
By default the candles sit side by side, skipping the gaps between them such as nights, weekends and holidays; the ticks are at the
candles where their dates fall. With skip-gaps: false, the time axis is linear and gaps stay empty.
When there are more candles than room for them, they are merged: the first open, the highest high, the lowest low and the last close,
and the tooltip shows the dates they span. On a linear time axis they are merged into hours, days, weeks (from Monday), months, quarters
or years in local time; with skip-gaps, into a few candles each, counted from the first. A merged candle at the edge always
holds all its candles, so its values don't change while panning, and zooming in shows the single candles again.
show-volume adds a strip of volume bars below the candles, on their own scale; show-last-price draws a dashed
line at the last close, labeled on the value axis. Hovering shows a crosshair, labeled with the price and date, and a tooltip with the
open, high, low and close, the change from the close before, the volume, and the lines' values. datasets draws lines over the
candles, such as a moving average: ChartEngine.moving-average(candles, period) computes one as points, and so does
slintplot::candle::moving_average in Rust.
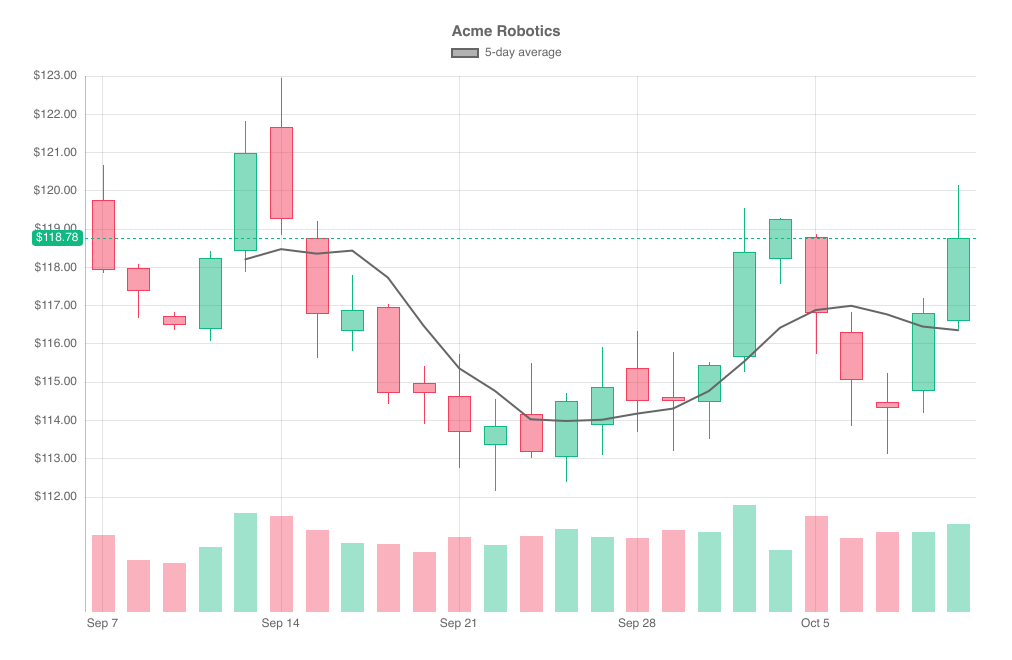
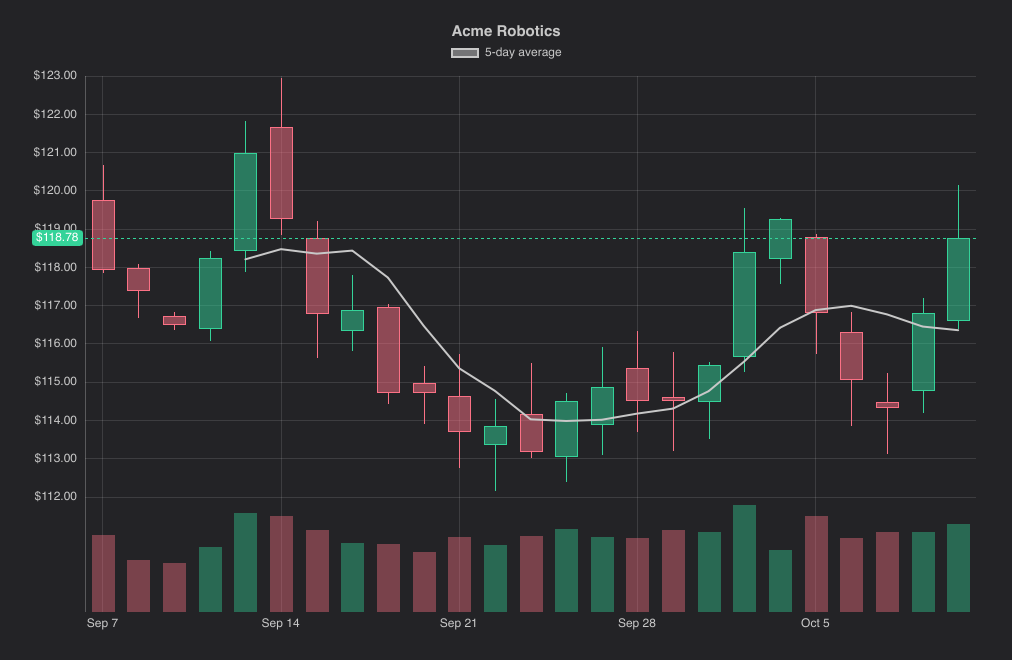
import { CandlestickChart, ChartEngine, ChartTheme } from "@slintplot";

CandlestickChart {
    title: "Acme Robotics";
    candles: [  // One candle per trading day: x is seconds after the time origin.
        { x:       0, open: 119.75, high: 120.68, low: 117.84, close: 117.94, volume: 3420000 },
        { x:   86400, open: 117.99, high: 118.08, low: 116.67, close: 117.38, volume: 2310000 },
        { x:  172800, open: 116.73, high: 116.83, low: 116.36, close: 116.49, volume: 2170000 },
        { x:  259200, open: 116.39, high: 118.43, low: 116.07, close: 118.25, volume: 2890000 },
        { x:  345600, open: 118.43, high: 121.83, low: 117.87, close: 120.99, volume: 4410000 },
        { x:  604800, open: 121.68, high: 122.94, low: 118.85, close: 119.27, volume: 4250000 },
        { x:  691200, open: 118.76, high: 119.20, low: 115.64, close: 116.79, volume: 3660000 },
        { x:  777600, open: 116.34, high: 117.79, low: 115.82, close: 116.89, volume: 3060000 },
        { x:  864000, open: 116.96, high: 117.04, low: 114.44, close: 114.72, volume: 3020000 },
        { x:  950400, open: 114.97, high: 115.41, low: 113.90, close: 114.71, volume: 2680000 },
        { x: 1209600, open: 114.64, high: 115.73, low: 112.75, close: 113.70, volume: 3350000 },
        { x: 1296000, open: 113.35, high: 114.57, low: 112.16, close: 113.85, volume: 2990000 },
        { x: 1382400, open: 114.17, high: 115.51, low: 113.01, close: 113.17, volume: 3380000 },
        { x: 1468800, open: 113.05, high: 114.71, low: 112.39, close: 114.50, volume: 3670000 },
        { x: 1555200, open: 113.87, high: 115.92, low: 113.09, close: 114.87, volume: 3310000 },
        { x: 1814400, open: 115.38, high: 116.35, low: 113.69, close: 114.51, volume: 3270000 },
        { x: 1900800, open: 114.62, high: 115.78, low: 113.21, close: 114.50, volume: 3620000 },
        { x: 1987200, open: 114.47, high: 115.53, low: 113.51, close: 115.45, volume: 3560000 },
        { x: 2073600, open: 115.65, high: 119.56, low: 115.26, close: 118.39, volume: 4750000 },
        { x: 2160000, open: 118.23, high: 119.30, low: 117.57, close: 119.26, volume: 2770000 },
        { x: 2419200, open: 118.79, high: 118.87, low: 115.74, close: 116.82, volume: 4280000 },
        { x: 2505600, open: 116.30, high: 116.84, low: 113.86, close: 115.06, volume: 3300000 },
        { x: 2592000, open: 114.48, high: 115.24, low: 113.12, close: 114.33, volume: 3540000 },
        { x: 2678400, open: 114.77, high: 117.19, low: 114.20, close: 116.80, volume: 3570000 },
        { x: 2764800, open: 116.61, high: 120.15, low: 116.39, close: 118.78, volume: 3920000 },
    ];
    datasets: [{ label: "5-day average", points: ChartEngine.moving-average(self.candles, 5), color: ChartTheme.text-color }];
    time-origin: { year: 2026, month: 9, day: 7 };
    value-prefix: "$";
    value-decimals: 2;
    show-volume: true;
    show-last-price: true;
    zoom-enabled: true;
    // skip-gaps: true;                              // false: a linear time axis, with gaps at weekends
    // ohlc: false;                                  // true: OHLC bars instead of candles
    // increase-color: #10b981;                      // default: ChartTheme.increase-color, a green
    // decrease-color: #f43f5e;                      // default: ChartTheme.decrease-color, a red
}| Property | Type | Default | Description |
|---|---|---|---|
candles | [ChartCandle] | One entry per period: x, open, high, low, close, volume, with x in seconds after time-origin; candles must be sorted by x. See Data types | |
datasets in-out | [ChartDataset] | [] | Lines over the candles: label, points, color, hidden, tension, stepped, with x in seconds like the candles' |
time-origin | ChartDateTime | 1970-01-01 | The time of x: 0, in UTC |
utc-offset | int | 0 | Minutes added to UTC for the times on the axis and in the tooltip, and for the periods candles are merged into |
title | string | "" | Shown above the chart |
skip-gaps | bool | true | Place the candles side by side, skipping gaps in time such as nights, weekends and holidays; false for a linear time axis |
ohlc | bool | false | OHLC bars instead of candles: a line from the low to the high, with ticks at the open (left) and close (right) |
show-volume | bool | false | Volume bars in a strip below the candles, a fifth of the plot high, on their own scale |
show-last-price | bool | false | A dashed line at the last candle's close, labeled on the value axis in its color |
show-crosshair | bool | true | Dashed lines through the mouse, with the price and the date labeled on the axes |
increase-color | color | ChartTheme.increase-color | The color of periods that closed at or above their open |
decrease-color | color | ChartTheme.decrease-color | The color of periods that closed below their open |
fill-opacity | float | ChartTheme.fill-opacity | The opacity of the candle bodies, whose outline stays solid |
show-legend | bool | true | A legend of the datasets, when there are any; clicking an entry hides or shows one |
legend-position | ChartLegendPosition | top | top, bottom, left or right |
show-tooltip | bool | true | A tooltip with the date, open, high, low and close of the candle under the mouse, the change from the close before, the volume (with show-volume) and the visible lines' values |
animated | bool | true | Grow the candles in when the chart appears |
decimate | bool | true | Merge candles closer than a few pixels into longer periods; turn off to draw every candle |
x-title | string | "" | The title of the horizontal axis |
y-title | string | "" | The title of the vertical axis |
fixed-range | bool | false | Use min-value and max-value instead of fitting the value axis to the candles in view |
min-value | float | 0 | The start of the value axis, with fixed-range |
max-value | float | 100 | The end of the value axis, with fixed-range |
logarithmic | bool | false | A logarithmic value axis |
value-prefix | string | "" | Written before every value, such as $ |
value-suffix | string | "" | Written after every value |
value-decimals | int | -1 | Decimals of every value; -1 picks them from the data |
zoom-enabled | bool | false | The mouse wheel zooms the time axis around the mouse, dragging pans, and a double-click resets |
view-start in-out | float | 0 | The start of the visible part of the time axis, from 0 to 1; set it to zoom from code |
view-end in-out | float | 1 | The end of the visible part of the time axis, from 0 to 1 |
min-view | float | 0.0005 | The smallest part of the time axis a zoom can show |
zoomed out | bool | Whether the chart is zoomed in | |
hovered-index out | int | The candle under the mouse or selected with the keyboard (of merged candles, the first), or -1 | |
hovered-last out | int | The last of the merged candles under the mouse; the same as hovered-index for a single candle | |
candle-clicked(first, last) | callback | A candle was clicked, or chosen with Enter: the first and last of the candles it merges, or its index twice | |
legend-toggled(index) | callback | A legend entry hid or showed a dataset |
HeatmapChart
A matrix of colored cells: rows (y-labels) by columns (x-labels), with values in row order.
Missing values (NaN) are drawn as empty cells.
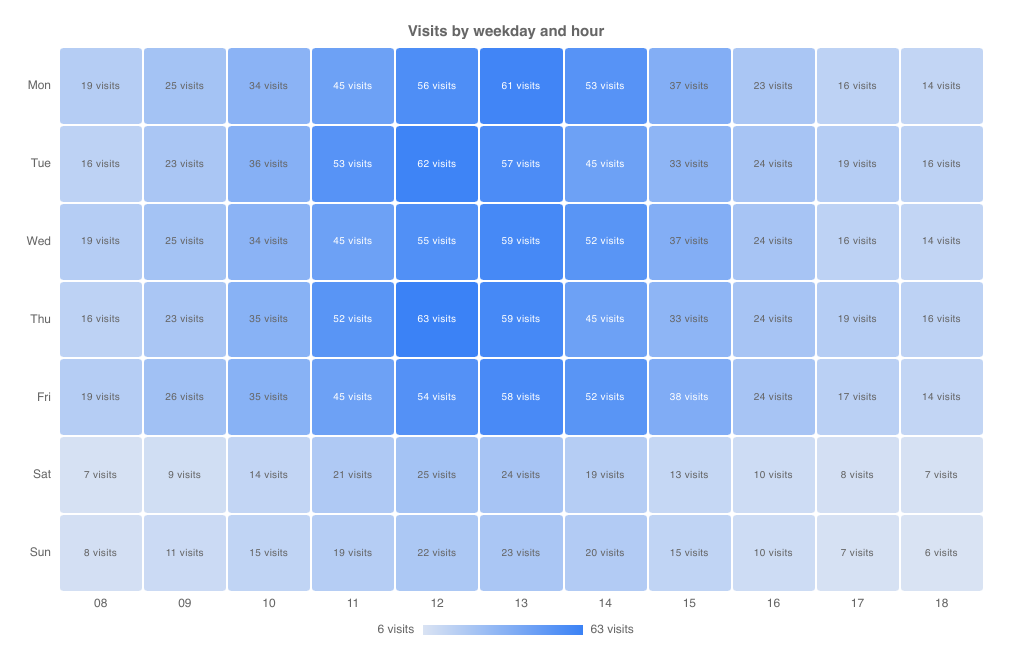
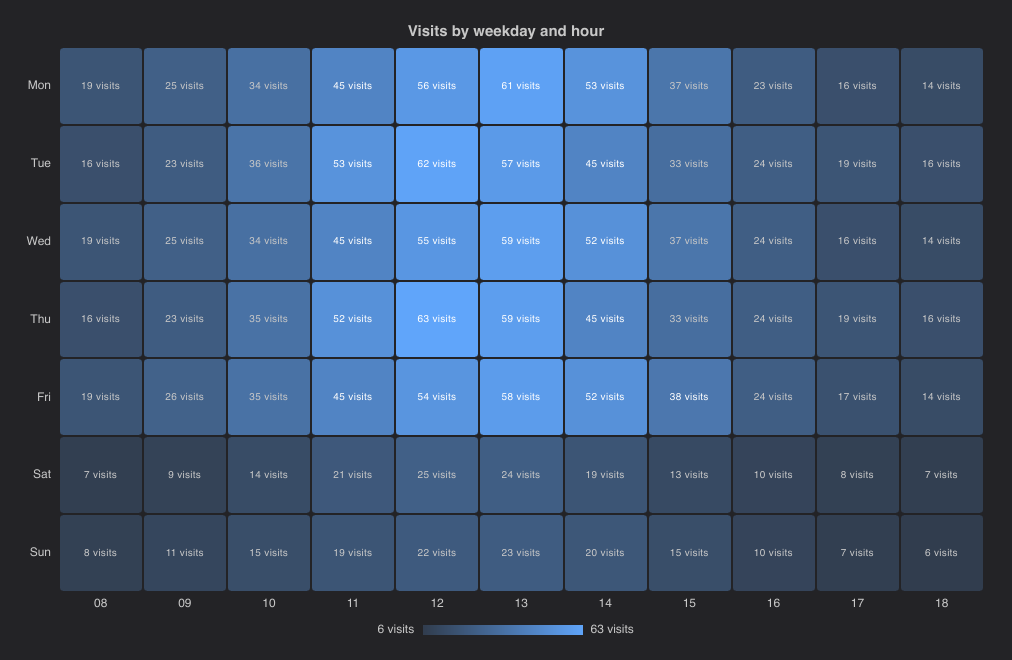
import { HeatmapChart } from "@slintplot";

HeatmapChart {
    title: "Visits by weekday and hour";
    x-labels: ["08", "09", "10", "11", "12", "13", "14", "15", "16", "17", "18"];
    y-labels: ["Mon", "Tue", "Wed", "Thu", "Fri", "Sat", "Sun"];
    values: [19, 25, 34, 45, 56, 61, 53, 37, 23, 16, 14,
             16, 23, 36, 53, 62, 57, 45, 33, 24, 19, 16,
             19, 25, 34, 45, 55, 59, 52, 37, 24, 16, 14,
             16, 23, 35, 52, 63, 59, 45, 33, 24, 19, 16,
             19, 26, 35, 45, 54, 58, 52, 38, 24, 17, 14,
              7,  9, 14, 21, 25, 24, 19, 13, 10,  8,  7,
              8, 11, 15, 19, 22, 23, 20, 15, 10,  7,  6];
    value-suffix: " visits";
    show-values: true;     // the number in each cell
}| Property | Type | Default | Description |
|---|---|---|---|
x-labels | [string] | The column labels | |
y-labels | [string] | The row labels | |
values | [float] | The cells in row order: values[row * columns + column]; NaN for an empty cell | |
title | string | "" | Shown above the chart |
color | color | ChartTheme.colors[0] | The color of the highest value; lower values are lighter |
diverging | bool | false | Two colors, split at center-value, for values around a center |
center-value | float | 0 | Where a diverging scale changes color |
negative-color | color | ChartTheme.colors[2] | The color of values below center-value |
fixed-range | bool | false | Use min-value and max-value for the color scale instead of the data's range |
min-value | float | 0 | The value of the lightest color, with fixed-range |
max-value | float | 100 | The value of the strongest color, with fixed-range |
show-values | bool | false | Write the value in each cell |
show-legend | bool | true | A color scale under the chart |
show-tooltip | bool | true | A tooltip with the values under the mouse |
cell-gap | length | 2px | The space between cells |
cell-radius | length | 3px | Rounded cell corners |
value-prefix | string | "" | Written before every value, such as $ |
value-suffix | string | "" | Written after every value, such as % |
value-decimals | int | -1 | Decimals of every value; -1 picks them from the data |
hovered-row out | int | The row of the cell under the mouse, or -1 | |
hovered-column out | int | The column of the cell under the mouse, or -1 | |
cell-clicked(row, column) | callback | A cell was clicked, or chosen with Enter |
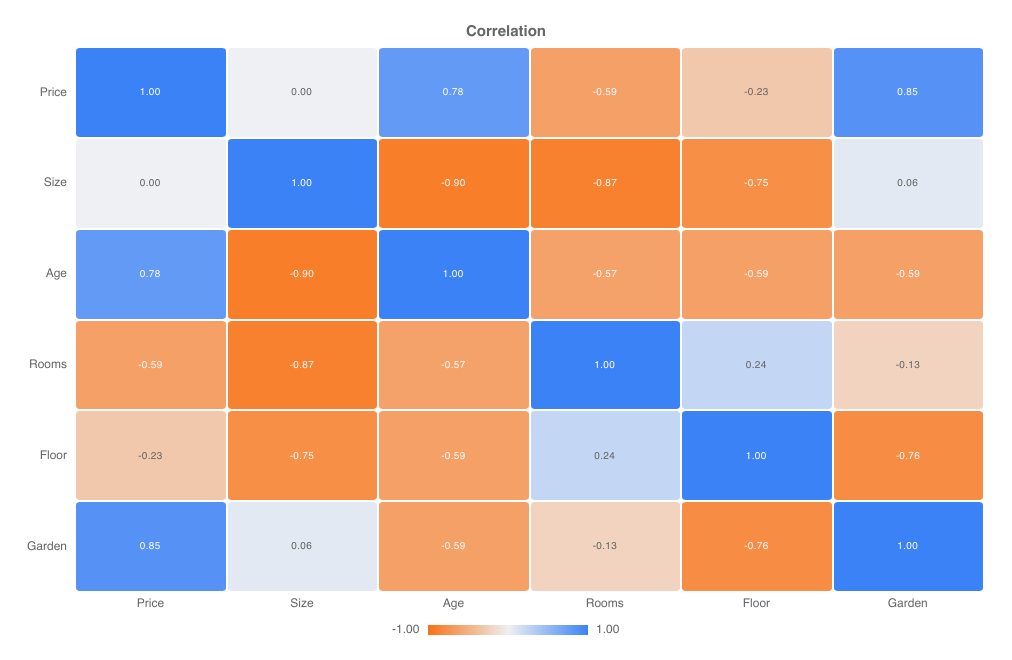
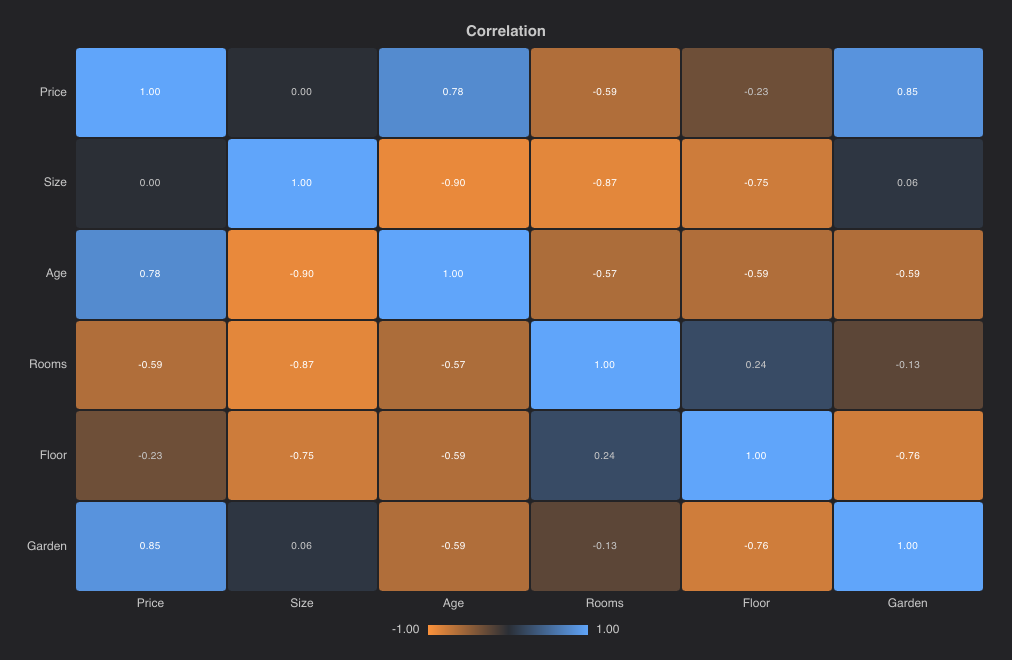
A diverging scale suits values around a center, such as correlations:
MatrixChart
A dot matrix: rows (y-labels) by columns (x-labels), with values in row order like a
HeatmapChart, but each cell holds a circle whose area is proportional to its value. Sizes compare more
precisely than shades, so it suits sales by product and region, feature scores across tools, or survey answers by group. Zero and
missing values draw nothing, or a short dash with show-empty; negative values are hollow circles, or with color-mode: sign filled in
negative-color. A size legend under the chart shows round values at the chart's scale, and the circles grow in when the chart
appears and resize when the values change.
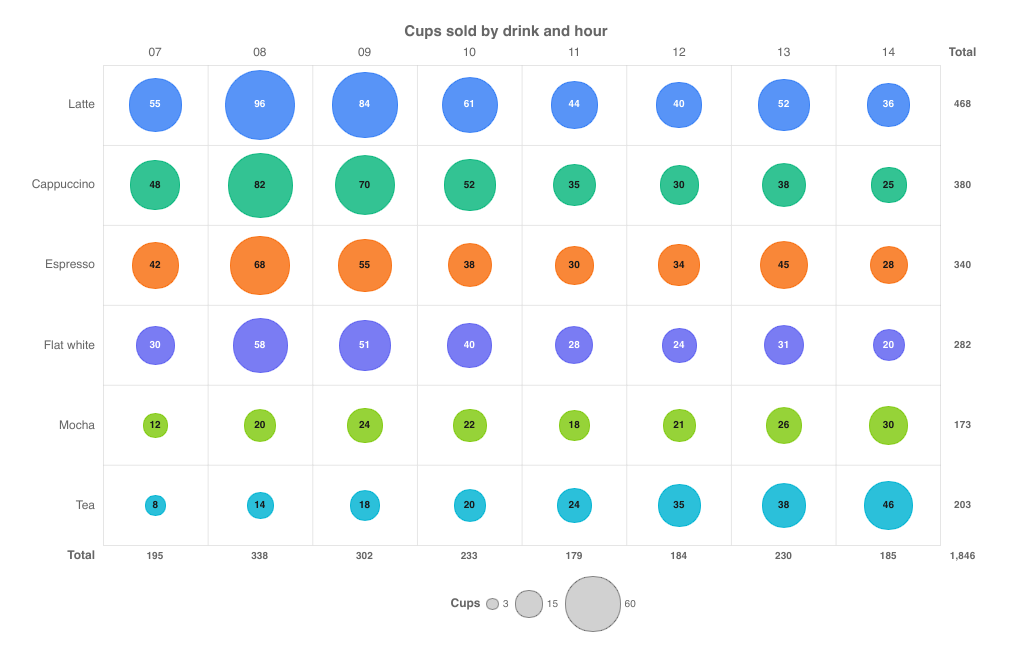
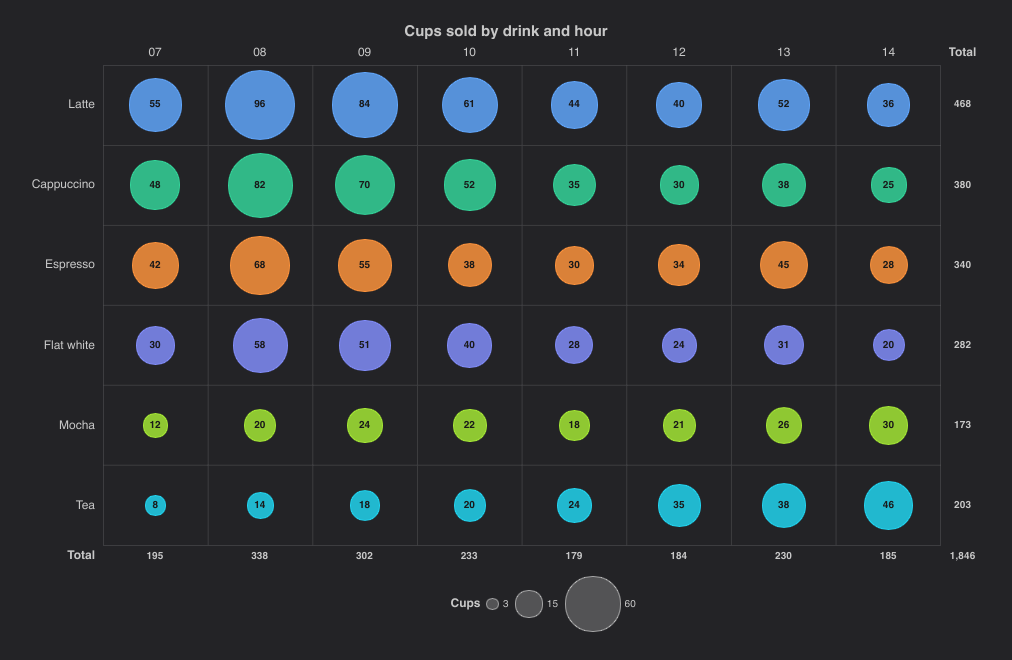
import { MatrixChart, ChartMatrixColorMode } from "@slintplot";

MatrixChart {
    title: "Cups sold by drink and hour";
    x-labels: ["07", "08", "09", "10", "11", "12", "13", "14"];
    y-labels: ["Latte", "Cappuccino", "Espresso", "Flat white", "Mocha", "Tea"];
    values: [55, 96, 84, 61, 44, 40, 52, 36,
             48, 82, 70, 52, 35, 30, 38, 25,
             42, 68, 55, 38, 30, 34, 45, 28,
             30, 58, 51, 40, 28, 24, 31, 20,
             12, 20, 24, 22, 18, 21, 26, 30,
              8, 14, 18, 20, 24, 35, 38, 46];
    color-mode: ChartMatrixColorMode.rows;    // a theme color per drink
    size-label: "Cups";
    show-values: true;
    show-totals: true;
    x-labels-top: true;                       // hours above, totals below
}| Property | Type | Default | Description |
|---|---|---|---|
x-labels | [string] | The column labels | |
y-labels | [string] | The row labels | |
values | [float] | The cells in row order: values[row * columns + column]; 0 or NaN for no circle | |
title | string | "" | Shown above the chart |
color-mode | ChartMatrixColorMode | single | single: all in color; rows, columns: a theme color per row or column; sign: color and negative-color; scale: from pale to color by color-values, diverging at zero with negative-color when they have both signs |
color | color | ChartTheme.colors[0] | The circles' color |
negative-color | color | ChartTheme.decrease-color | Negative values with color-mode: sign, and the low end of a diverging scale |
color-values | [float] | [] | A second measure that colors the circles with color-mode: scale, in the order of values; empty to color by the values |
size-label, color-label | string | "" | What the values and color values are, such as "Sales" and "Growth", for the legend and tooltip |
fixed-range | bool | false | Size the circles against max-value instead of the largest value, so that charts compare |
max-value | float | 100 | With fixed-range, the value of a circle that fills its cell; larger values do too |
show-values | bool | false | Write each value in its circle, or under it when it doesn't fit |
show-empty | bool | false | A short dash in each cell without a value (NaN, or past the end of values), so that it differs from a cell of 0, which stays blank |
show-totals | bool | false | A column of row totals and a row of column totals, when the cells have room for them |
show-legend | bool | true | The size legend, and with color-mode: scale the color scale |
show-tooltip | bool | true | A tooltip with the row, column and value under the mouse |
x-labels-top | bool | false | The column labels above the matrix, instead of below it |
animated | bool | true | Grow the circles on appearing, and resize them when the values change |
value-prefix | string | "" | Written before every value, such as $ |
value-suffix | string | "" | Written after every value, such as % |
value-decimals | int | -1 | Decimals of every value; -1 picks them from the data |
color-value-prefix, color-value-suffix, color-value-decimals | The same for color-values | ||
hovered-row out | int | The row of the cell under the mouse or selected with the keyboard, or -1 | |
hovered-column out | int | The column of the cell under the mouse or selected with the keyboard, or -1 | |
cell-clicked(row, column) | callback | A cell was clicked, or chosen with Enter |
A second measure can color the circles while their size shows the first, such as sales colored by growth on last year:
MatrixChart {
    x-labels: root.regions;
    y-labels: root.products;
    values: root.sales;
    color-mode: ChartMatrixColorMode.scale;
    color-values: root.growth;                // blue for growth, the theme's red for decline
    size-label: "Sales";
    color-label: "Growth";
    value-prefix: "$";
    value-suffix: "M";
    color-value-suffix: ChartTexts.percent;
}
Large matrices stay fast: when cells get smaller than a few pixels, as with 500 by 500 values on a small chart, neighboring cells merge into one circle that shows the value farthest from zero, while the tooltip still reads the exact cell under the mouse.
CalendarHeatmap
A year (or any span) of daily values, like GitHub's contribution graph: one column per week, one row per weekday, with month and
weekday labels and a "Less … More" legend. Days are colored in levels steps, split by quantiles of the positive values,
so a few very active days don't wash out the rest; zero or missing days are empty. The days take the theme's first color, in
lighter shades for fewer contributions; set color for another, such as GitHub's green.
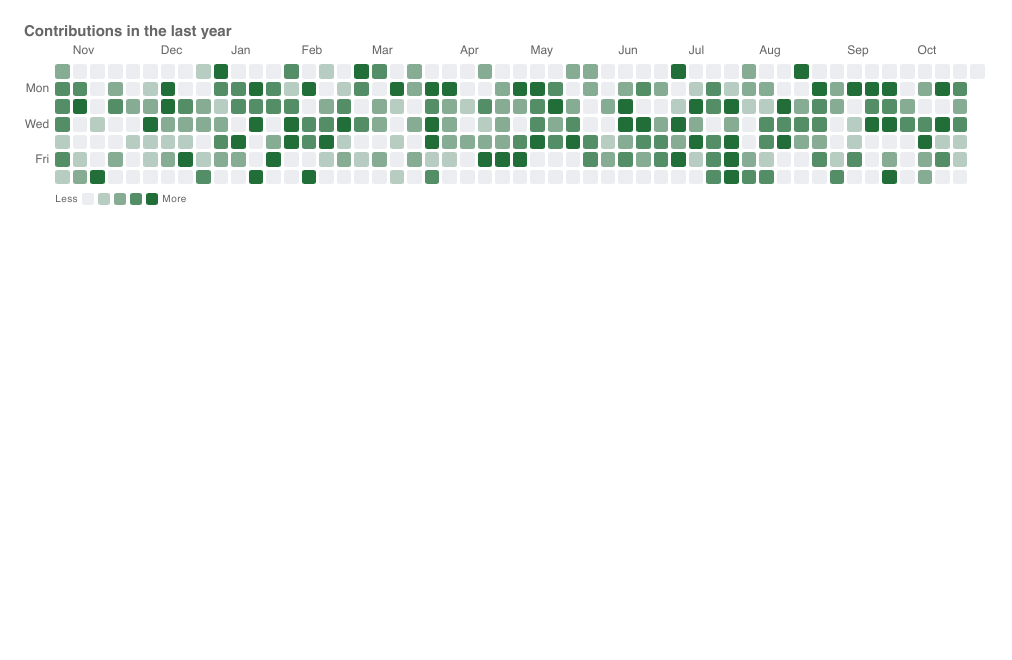
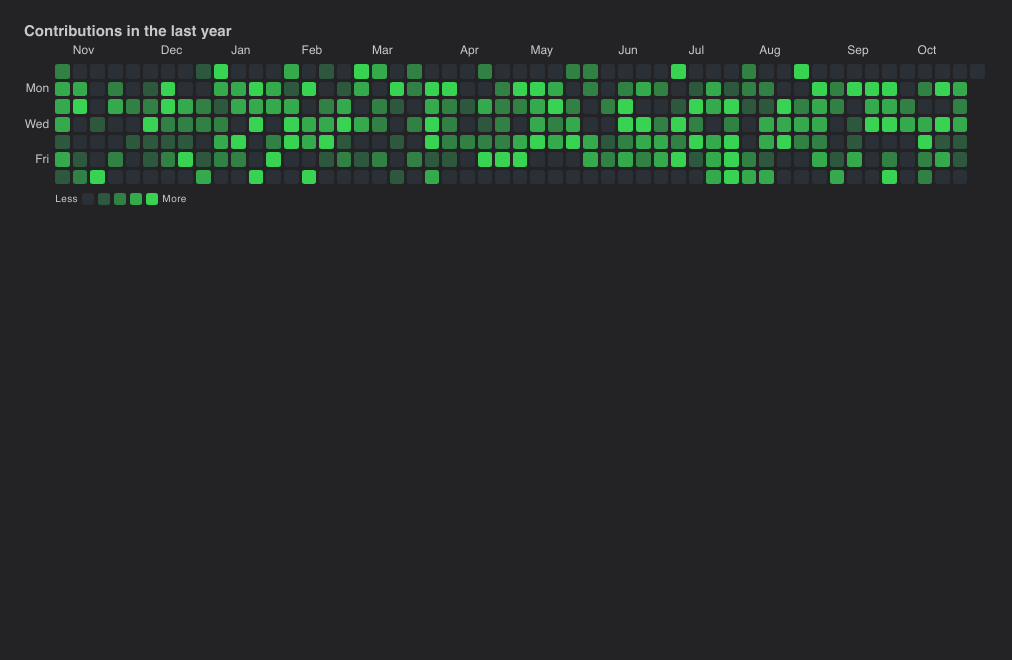
import { CalendarHeatmap, ChartTheme } from "@slintplot";

CalendarHeatmap {
    title: "Contributions in the last year";
    start-date: { year: 2025, month: 10, day: 26 };
    values: root.daily-counts;                        // one value per day
    color: ChartTheme.dark ? #39d353 : #216e39;       // GitHub's green; default ChartTheme.colors[0]
    value-suffix: " contributions";
}| Property | Type | Default | Description |
|---|---|---|---|
start-date | ChartDateTime | The date of the first value | |
values | [float] | One value per day | |
title | string | "" | Shown above the chart |
color | color | ChartTheme.colors[0] | The color of the busiest days; quieter days are lighter |
levels | int | 4 | Color steps besides empty |
week-starts-monday | bool | false | Start weeks on Monday instead of Sunday |
show-legend | bool | true | The Less … More scale under the calendar |
show-tooltip | bool | true | A tooltip with the values under the mouse |
cell-gap | length | 3px | The space between days |
cell-radius | length | 2px | Rounded day corners |
min-cell-size | length | 11px | The smallest day; with less room, the calendar scrolls |
value-prefix | string | "" | Written before every value, such as $ |
value-suffix | string | "" | Written after every value, such as % |
value-decimals | int | -1 | Decimals of every value; -1 picks them from the data |
hovered-index out | int | The day under the mouse or selected with the keyboard, or -1 | |
day-clicked(index) | callback | A day was clicked, or chosen with Enter; index counts from start-date |
TileGridChart
A matrix as rows of rounded squares, one per value, like an activity grid. It takes its data as a
SegmentedRingChart does: values is a matrix, [[float]], one row of tiles per
row, and the chart takes its size from it, as many rows as the matrix has and as many columns as its longest row. The tiles stay square,
as large as fit, and the grid is centered. Shorter rows and missing values (NaN) are empty tiles, a faint track. Cells are colored on a
scale, with the same properties as a HeatmapChart, or by category: with classes set, each value is the
index of its category, and the categories make the legend. y-labels go at the left and x-labels below, thinned to
those that fit.
Use a TileGridChart where the cells should look alike and square, such as days or builds, and a HeatmapChart where the cells should fill the space or show their numbers.
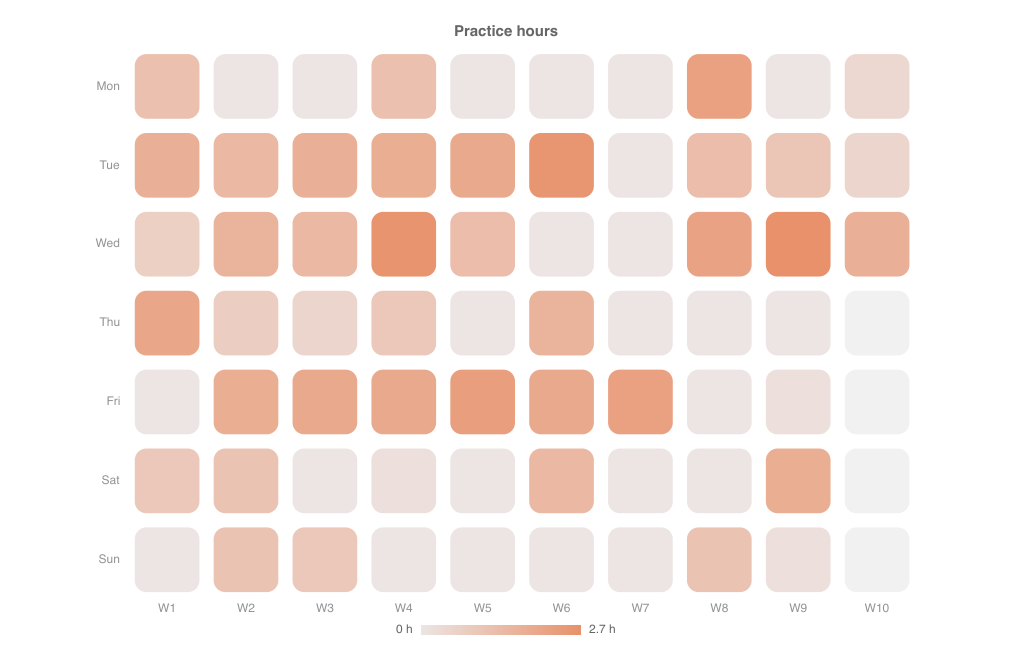
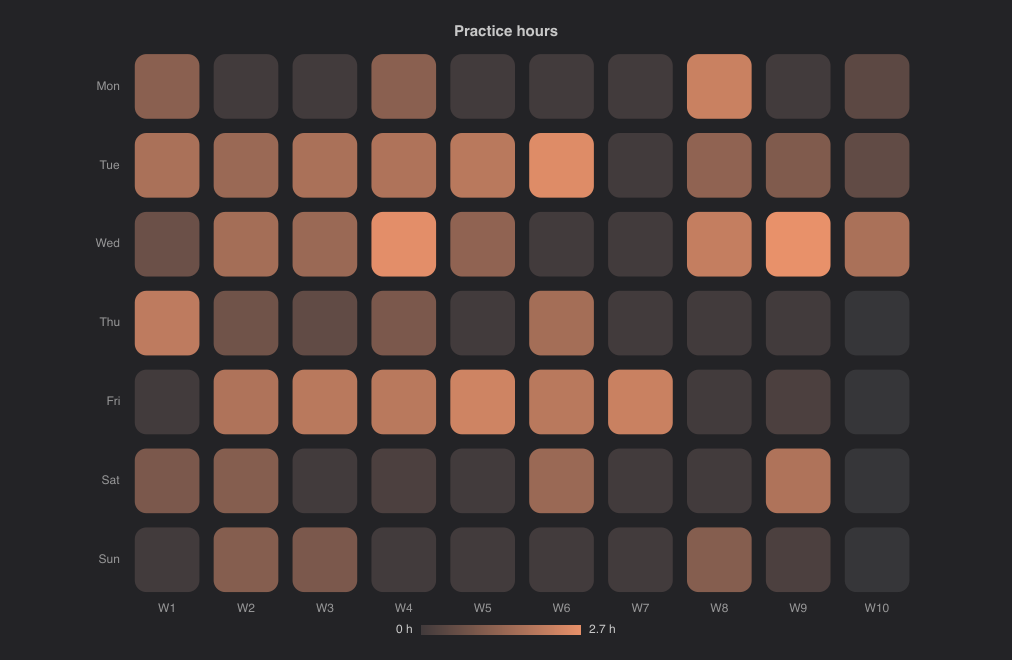
import { TileGridChart } from "@slintplot";

TileGridChart {
    title: "Practice hours";
    // One row per weekday, one column per week. This week has only reached
    // Wednesday, so the rows after it are shorter and end in the track.
    values: [
        [1.2, 0, 0, 1.2, 0, 0, 0, 2.2, 0, 0.4],
        [1.7, 1.4, 1.7, 1.8, 1.9, 2.5, 0, 1.3, 1, 0.5],
        [0.7, 1.6, 1.4, 2.6, 1.3, 0, 0, 2.1, 2.7, 1.7],
        [2, 0.8, 0.5, 0.9, 0, 1.6, 0, 0, 0],
        [0, 1.8, 1.9, 1.9, 2.3, 1.9, 2.2, 0, 0.2],
        [0.9, 1.1, 0, 0.2, 0, 1.4, 0, 0, 1.8],
        [0, 1.1, 0.9, 0, 0, 0, 0, 1.1, 0.2],
    ];
    y-labels: ["Mon", "Tue", "Wed", "Thu", "Fri", "Sat", "Sun"];
    x-labels: ["W1", "W2", "W3", "W4", "W5", "W6", "W7", "W8", "W9", "W10"];
    color: #e8916a;
    value-suffix: " h";
}| Property | Type | Default | Description |
|---|---|---|---|
values | [[float]] | The matrix: one row of tiles per row. NaN, and a row's missing end, are empty tiles | |
x-labels | [string] | [] | The columns' labels, below the grid |
y-labels | [string] | [] | The rows' labels, at the left |
classes in-out | [ChartSlice] | [] | Color by category: a value is a category index, and each category has a label, color and hidden flag. Empty for a color scale |
title | string | "" | Shown above the chart |
color | color | first theme color | The scale's color for the largest value |
diverging, center-value, negative-color | bool, float, color | false, 0, third theme color | A diverging scale around center-value, as in a heatmap |
fixed-range, min-value, max-value | bool, float, float | false, 0, 100 | A fixed range for the scale instead of the data's |
tile-gap | float | 0.18 | The gap between tiles, as a share of a tile |
tile-radius | float | 0.18 | The corner radius, as a share of a tile; 0 for squares, 0.5 for circles |
track-color | color | unset | The empty tiles; unset for a faint gray |
show-labels | bool | true | The row and column labels |
show-legend | bool | true | The categories, which hide and show on click, or the color scale |
legend-position | ChartLegendPosition | bottom | Where the categories' legend goes |
legend-attached | bool | true | Keep the legend next to the chart, not at the edge of its area, when the chart leaves room around it; false for the edge |
show-tooltip | bool | true | A tooltip with the tile under the mouse |
animated | bool | true | Sweep the tiles in from the left when the chart appears |
value-prefix, value-suffix, value-decimals | string, string, int | "", "", -1 | How values on a scale are written |
hovered-row, hovered-column out | int | The tile under the mouse or selected with the keyboard, or -1 | |
cell-clicked(row, column) | callback | A tile was clicked, or chosen with Enter | |
legend-toggled(index) | callback | A legend entry hid or showed a category |
By category, each value names its category, and -1 or NaN leaves the tile empty:
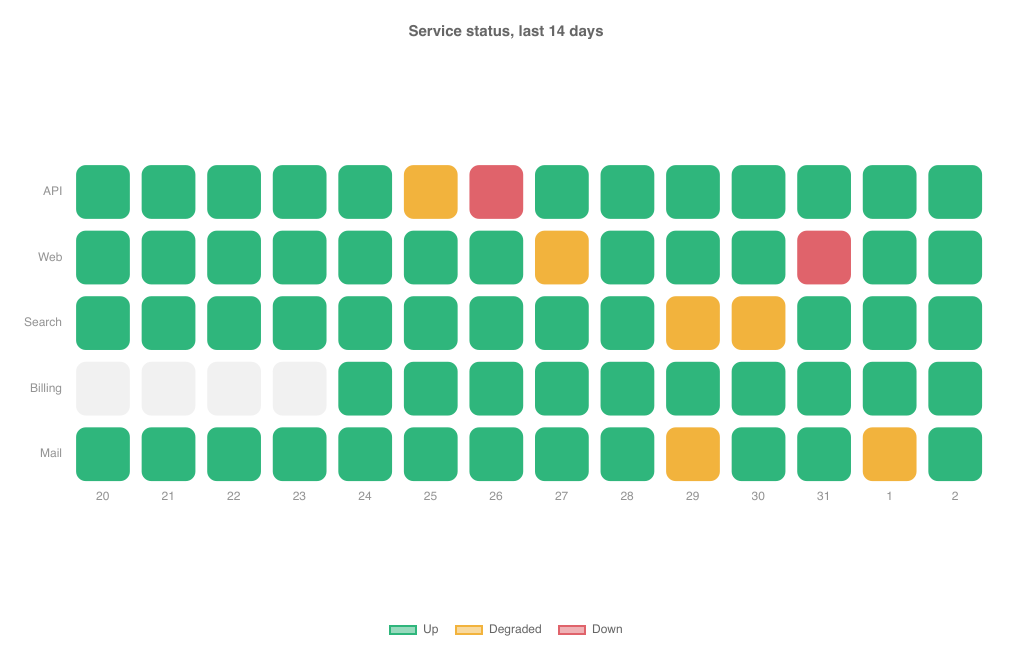
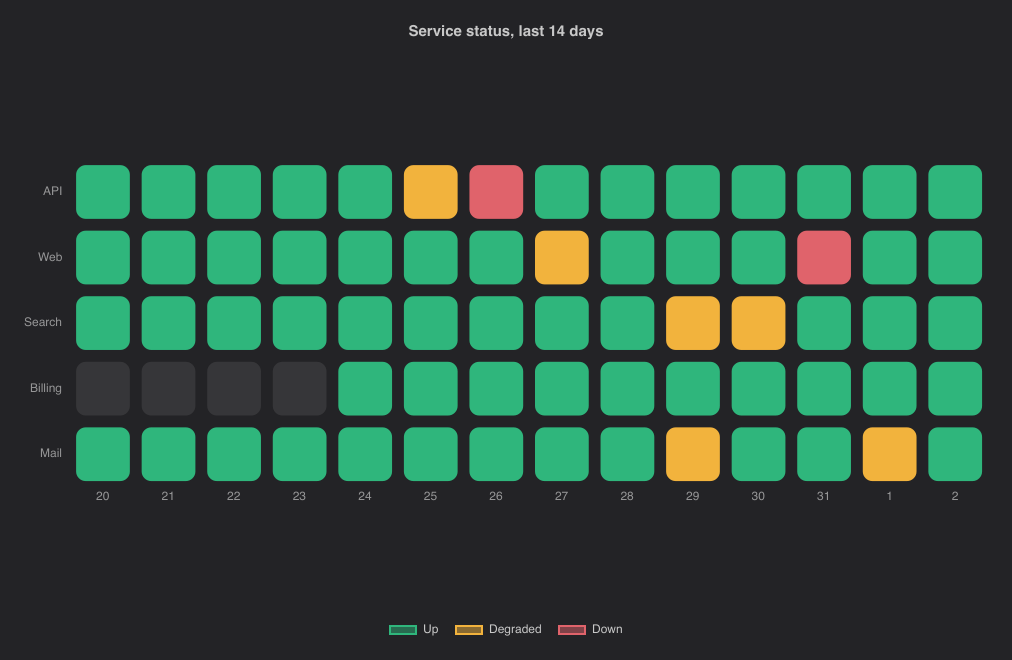
import { TileGridChart } from "@slintplot";

TileGridChart {
    title: "Service status, last 14 days";
    // 0: up, 1: degraded, 2: down, -1: not monitored yet.
    values: [
        [0, 0, 0, 0, 0, 1, 2, 0, 0, 0, 0, 0, 0, 0],
        [0, 0, 0, 0, 0, 0, 0, 1, 0, 0, 0, 2, 0, 0],
        [0, 0, 0, 0, 0, 0, 0, 0, 0, 1, 1, 0, 0, 0],
        [-1, -1, -1, -1, 0, 0, 0, 0, 0, 0, 0, 0, 0, 0],
        [0, 0, 0, 0, 0, 0, 0, 0, 0, 1, 0, 0, 1, 0],
    ];
    y-labels: ["API", "Web", "Search", "Billing", "Mail"];
    x-labels: ["20", "21", "22", "23", "24", "25", "26", "27", "28", "29", "30", "31", "1", "2"];
    classes: [
        { label: "Up", color: #2fb67c },
        { label: "Degraded", color: #f2b33d },
        { label: "Down", color: #e0636b },
    ];
}
From Rust, the matrix is a model of models, as for a SegmentedRingChart; a changed cell redraws the chart. Large matrices stay fast: the tiles are drawn as one path per color, tiles too small for visible corners are drawn as squares, and a matrix is cut to its first 200 rows and 1,000 columns.
TreemapChart
One rectangle per item, with an area proportional to its value, laid out with the squarified algorithm so the rectangles stay
close to square. Items with the same group are placed together under the group's label and share the group's color;
the legend lists the groups, and clicking one hides it. Without groups, every item gets its own theme color and there is no legend.
Missing, zero and negative values take no space. Labels and values are written in the rectangles where they fit, in white or dark
text depending on the fill.
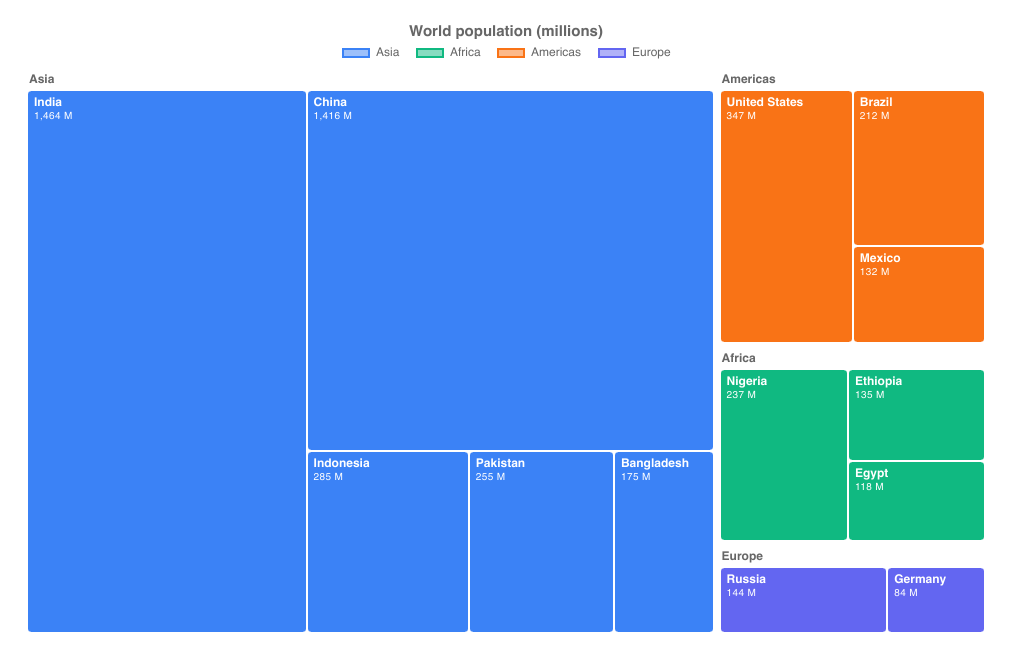
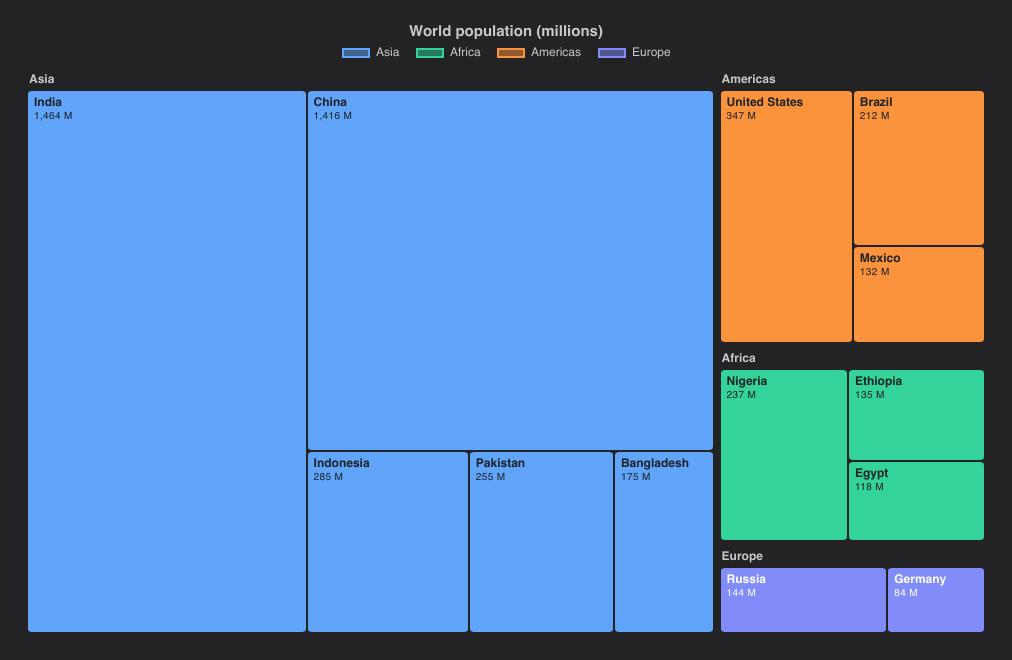
import { TreemapChart } from "@slintplot";

TreemapChart {
    title: "World population (millions)";
    items: [
        { label: "India", value: 1464, group: "Asia" },
        { label: "China", value: 1416, group: "Asia" },
        { label: "Indonesia", value: 285, group: "Asia" },
        { label: "Pakistan", value: 255, group: "Asia" },
        { label: "Bangladesh", value: 175, group: "Asia" },
        { label: "Nigeria", value: 237, group: "Africa" },
        { label: "Ethiopia", value: 135, group: "Africa" },
        { label: "Egypt", value: 118, group: "Africa" },
        { label: "United States", value: 347, group: "Americas" },
        { label: "Brazil", value: 212, group: "Americas", color: transparent },  // transparent: the group's color
        { label: "Mexico", value: 132, group: "Americas" },
        { label: "Russia", value: 144, group: "Europe" },
        { label: "Germany", value: 84, group: "Europe" },
    ];
    value-suffix: " M";
}| Property | Type | Default | Description |
|---|---|---|---|
items in-out | [ChartTreemapItem] | One entry per rectangle: label, value, group, color. Items of a group are placed together. See Data types | |
title | string | "" | Shown above the chart |
show-values | bool | true | Write each value under its label, where there is room |
cell-gap | length | 2px | The space between rectangles; groups are three gaps apart |
cell-radius | length | 3px | Rounded corners |
show-legend | bool | true | A legend of the groups; clicking one hides or shows it |
legend-position | ChartLegendPosition | top | top, bottom, left or right |
show-tooltip | bool | true | A tooltip with the values under the mouse |
value-prefix | string | "" | Written before every value, such as $ |
value-suffix | string | "" | Written after every value, such as % |
value-decimals | int | -1 | Decimals of every value; -1 picks them from the data |
hovered-index out | int | The item under the mouse or selected with the keyboard, or -1 | |
item-clicked(index) | callback | An item was clicked, or chosen with Enter; index is its place in items | |
legend-toggled(index) | callback | A legend entry hid or showed a group |
SunburstChart
A hierarchy drawn as rings: the top level innermost, and each item's angle its share of its parent. Items name their parent by
index, and a parent must come before its children; an item whose parent is -1 (or invalid) is top-level. Leave a parent's
value at 0 and it is the sum of its children; a parent with a larger value of its own keeps the rest of its angle empty.
Top-level items take the theme's colors in order and their children a lighter shade of their parent's. Clicking an item with
children zooms into it, so that it fills the rings; clicking the center zooms back out. The center shows the total of what is shown.
Labels are written on the arcs where they fit, and the legend lists the top-level items.
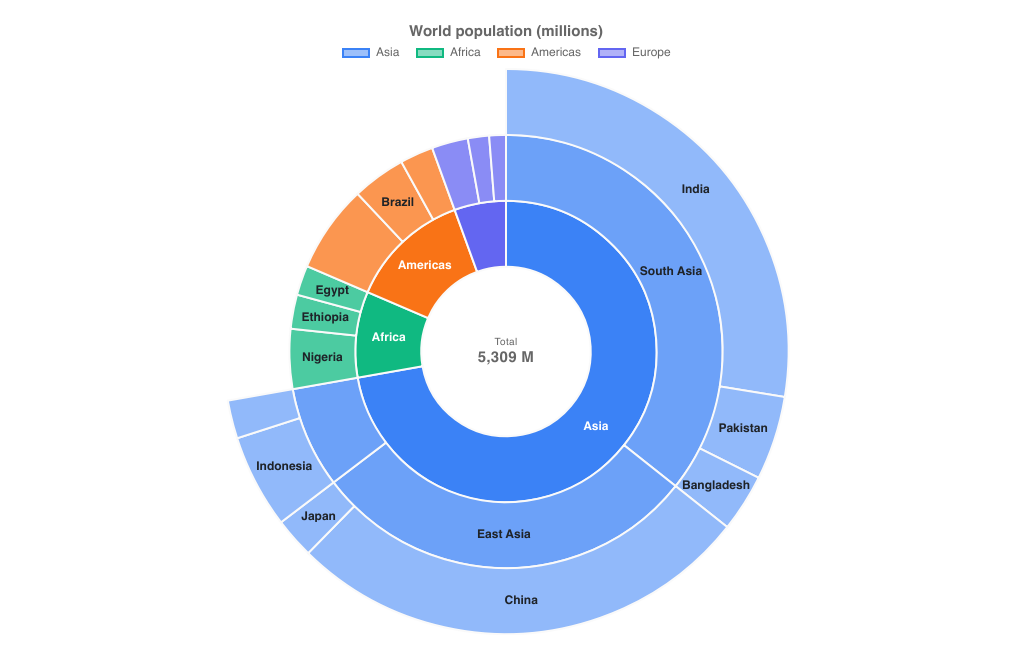
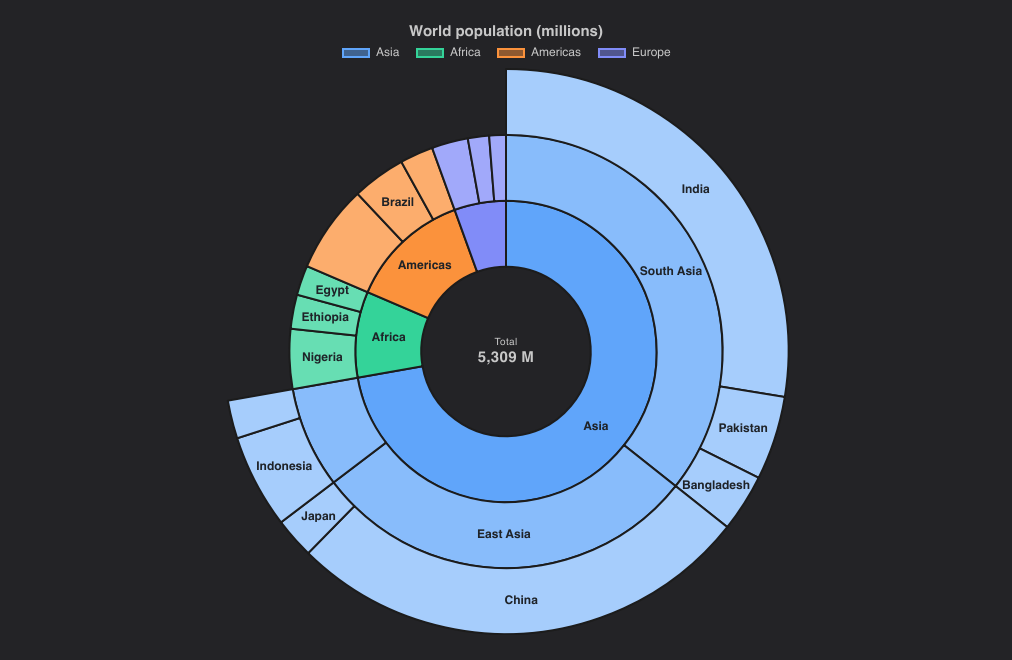
import { SunburstChart } from "@slintplot";

SunburstChart {
    title: "World population (millions)";
    items: [
        { label: "Asia", parent: -1 },                // 0: its value is the sum of its children
        { label: "South Asia", parent: 0 },           // 1
        { label: "India", value: 1464, parent: 1 },
        { label: "Pakistan", value: 255, parent: 1 },
        { label: "Bangladesh", value: 175, parent: 1 },
        { label: "East Asia", parent: 0 },            // 5
        { label: "China", value: 1416, parent: 5 },
        { label: "Japan", value: 123, parent: 5 },
        { label: "Southeast Asia", parent: 0 },       // 8
        { label: "Indonesia", value: 285, parent: 8 },
        { label: "Philippines", value: 116, parent: 8 },
        { label: "Africa", parent: -1 },              // 11
        { label: "Nigeria", value: 237, parent: 11 },
        { label: "Ethiopia", value: 135, parent: 11 },
        { label: "Egypt", value: 118, parent: 11 },
        { label: "Americas", parent: -1 },            // 15
        { label: "United States", value: 347, parent: 15 },
        { label: "Brazil", value: 212, parent: 15 },
        { label: "Mexico", value: 132, parent: 15 },
        { label: "Europe", parent: -1, color: transparent },  // 19; transparent: the theme's next color
        { label: "Russia", value: 144, parent: 19 },
        { label: "Germany", value: 84, parent: 19 },
        { label: "France", value: 66, parent: 19, hidden: false },
    ];
    value-suffix: " M";
}| Property | Type | Default | Description |
|---|---|---|---|
items in-out | [ChartSunburstItem] | One entry per arc: label, value, parent, color, hidden. A parent comes before its children. See Data types | |
title | string | "" | Shown above the chart |
show-labels | bool | true | Write each label on its arc, where it fits |
cutout | float | 0.3 | The size of the center circle, as a share of the radius |
center-label | string | "Total" | Shown above the total in the center, in the chart's language |
zoom-item in-out | int | -1 | The item zoomed into, or -1 for all; set it to zoom from code |
show-legend | bool | true | A legend of the top-level items; clicking one hides or shows it |
legend-position | ChartLegendPosition | top | top, bottom, left or right |
legend-attached | bool | true | Keep the legend next to the chart, not at the edge of its area, when the chart leaves room around it; false for the edge |
show-tooltip | bool | true | A tooltip with the values under the mouse |
animated | bool | true | Sweep the rings in when the chart appears |
value-prefix | string | "" | Written before every value, such as $ |
value-suffix | string | "" | Written after every value, such as % |
value-decimals | int | -1 | Decimals of every value; -1 picks them from the data |
hovered-index out | int | The item under the mouse or selected with the keyboard, or -1 | |
item-clicked(index) | callback | An item was clicked; index is its place in items | |
zoomed(index) | callback | The chart zoomed into an item, or out to -1 | |
legend-toggled(index) | callback | A legend entry hid or showed a top-level item |
FunnelChart
The stages as slices of one funnel: each slice is as wide at the top as its value and narrows to the next stage, with curved sides.
Stages fade from color at the top to lighter shades below (darker in dark mode), so the order reads in the color; a
stage's own color wins. Each slice shows its value and its share of the first stage, beside the slice when it is too
narrow, and badges on the right show the share of the previous stage each one kept. Hovering a stage fades the others. With so many stages that the
rows are too short for text, the names, values and badges are left out, and the tooltip shows them. Stages are
ChartSlices, as in pie charts.
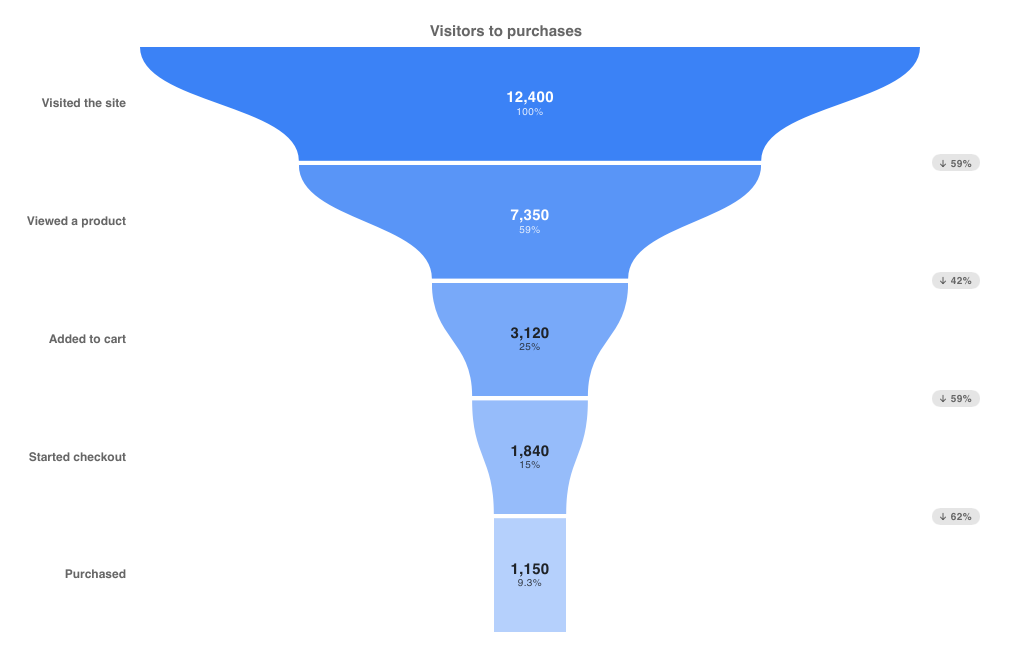
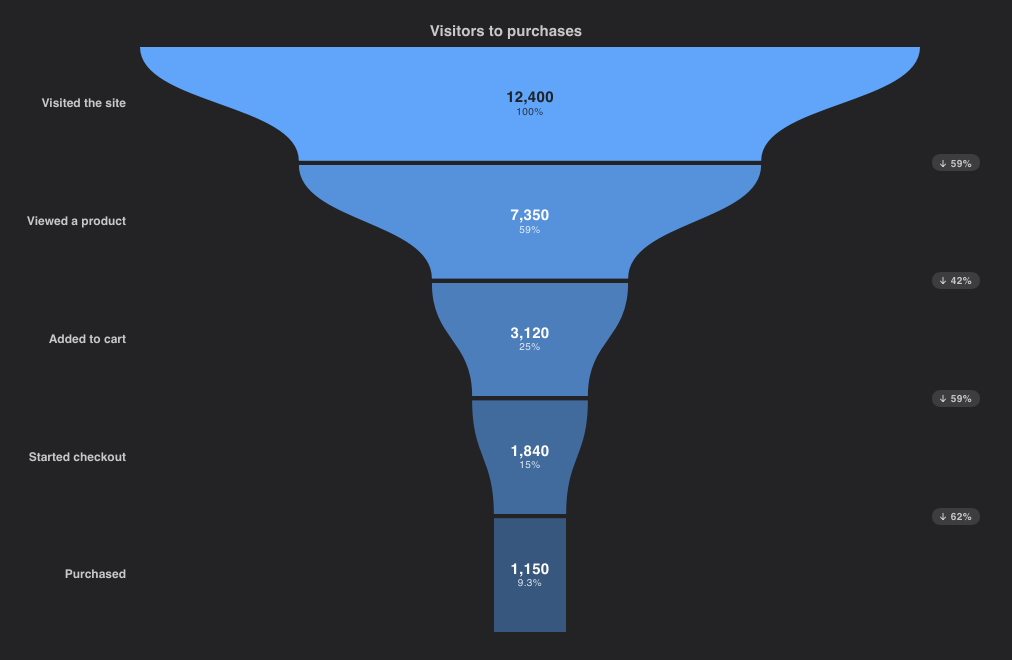
import { FunnelChart } from "@slintplot";

FunnelChart {
    title: "Visitors to purchases";
    stages: [
        { label: "Visited the site", value: 12400 },
        { label: "Viewed a product", value: 7350 },
        { label: "Added to cart", value: 3120 },
        { label: "Started checkout", value: 1840 },
        { label: "Purchased", value: 1150, color: transparent, hidden: false },  // transparent: the fade
    ];
}| Property | Type | Default | Description |
|---|---|---|---|
stages in-out | [ChartSlice] | One entry per stage, from the first to the last: label, value, color, hidden. See Data types | |
title | string | "" | Shown above the chart |
color | color | ChartTheme.colors[0] | The first stage's color; the others fade from it |
curved | bool | true | Curved sides between the stages; false for straight ones |
gap | length | 4px | The space between the stages |
show-labels | bool | true | The stage names on the left |
show-values | bool | true | Each stage's value on its slice |
show-percentages | bool | true | Each stage's share of the first stage |
show-conversions | bool | true | Badges with the share of the previous stage kept |
show-legend | bool | false | A legend of the stages; clicking one hides or shows it |
legend-position | ChartLegendPosition | top | top, bottom, left or right |
show-tooltip | bool | true | A tooltip with the values under the mouse |
animated | bool | true | Open the stages out one after the other when the chart appears |
value-prefix | string | "" | Written before every value, such as $ |
value-suffix | string | "" | Written after every value, such as % |
value-decimals | int | -1 | Decimals of every value; -1 picks them from the data |
hovered-index out | int | The stage under the mouse or selected with the keyboard, or -1 | |
stage-clicked(index) | callback | A stage was clicked, or chosen with Enter | |
legend-toggled(index) | callback | A legend entry hid or showed a stage |
WaterfallChart
Each step's bar floats from the running total before it to the total after it: green when it adds, red when it takes away.
Steps with total: true are bars from zero to the running total, in the theme's first color, and their value is
ignored. Thin lines connect each bar's end to the next bar. The value axis always includes zero; the tooltip shows the change and
the running total. Negative values are written with the sign before the prefix: "-$48k".
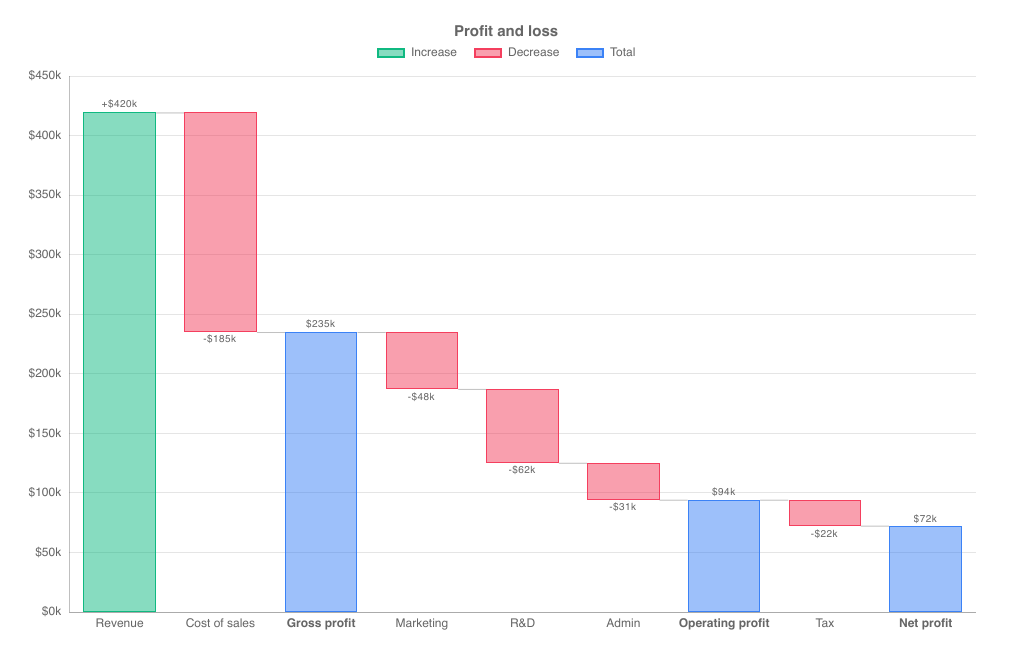
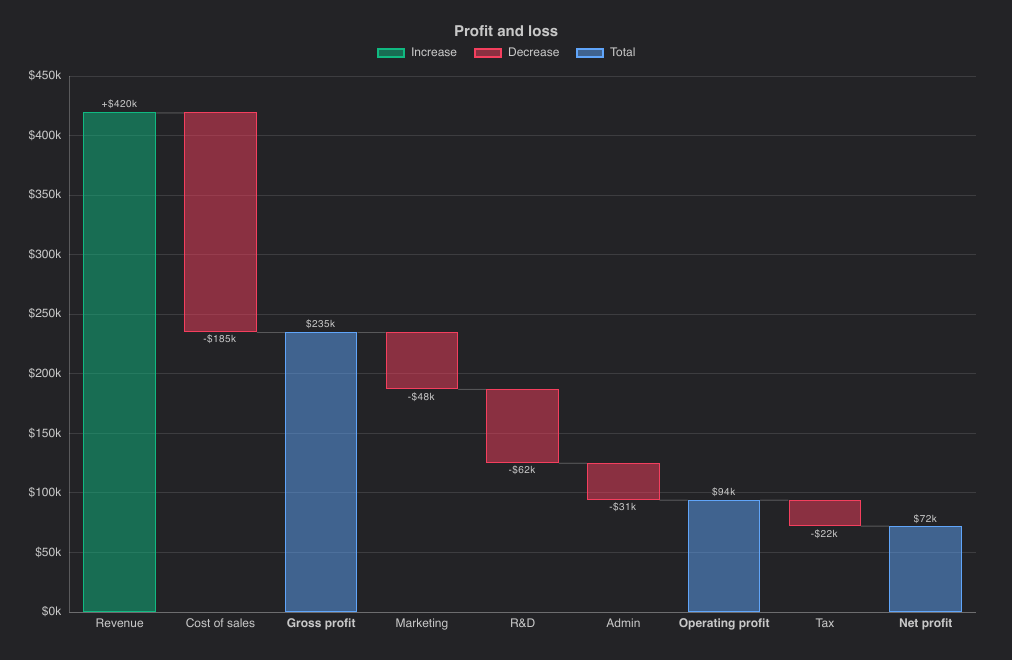
import { WaterfallChart } from "@slintplot";

WaterfallChart {
    title: "Profit and loss";
    steps: [
        { label: "Revenue", value: 420 },
        { label: "Cost of sales", value: -185 },
        { label: "Gross profit", total: true },
        { label: "Marketing", value: -48 },
        { label: "R&D", value: -62 },
        { label: "Admin", value: -31 },
        { label: "Operating profit", total: true },
        { label: "Tax", value: -22 },
        { label: "Net profit", total: true },
    ];
    show-values: true;
    increase-color: #10b981;                          // default: ChartTheme.increase-color, a green
    decrease-color: #f43f5e;                          // default: ChartTheme.decrease-color, a red
    value-prefix: "$";
    value-suffix: "k";
}| Property | Type | Default | Description |
|---|---|---|---|
steps | [ChartWaterfallStep] | One entry per bar: label, value, total. A step with total: true shows the running total. See Data types | |
title | string | "" | Shown above the chart |
show-values | bool | false | Write each change, with its sign, or total by its bar |
show-connectors | bool | true | Lines from each bar's end to the next bar |
increase-color | color | ChartTheme.increase-color | The color of increases |
decrease-color | color | ChartTheme.decrease-color | The color of decreases |
total-color | color | ChartTheme.colors[0] | The color of totals |
increase-label | string | "Increase" | The legend entry for increases, in the chart's language |
decrease-label | string | "Decrease" | The legend entry for decreases |
total-label | string | "Total" | The legend entry for totals |
fill-opacity | float | ChartTheme.fill-opacity | The opacity of filled marks: the bars. The theme's default is 0.5 |
bar-radius | length | 0 | Rounded bar corners |
bar-border-width | length | 1px | The width of the solid bar outline |
show-legend | bool | true | A legend of the three colors |
legend-position | ChartLegendPosition | top | top, bottom, left or right |
show-tooltip | bool | true | A tooltip with the values under the mouse |
animated | bool | true | Grow the data in when the chart appears, and move to new values |
x-title | string | "" | The title of the horizontal axis |
y-title | string | "" | The title of the vertical axis |
value-prefix | string | "" | Written before every value, such as $ |
value-suffix | string | "" | Written after every value, such as % |
value-decimals | int | -1 | Decimals of every value; -1 picks them from the data |
hovered-index out | int | The step under the mouse or selected with the keyboard, or -1 | |
step-clicked(index) | callback | A step was clicked, or chosen with Enter |
DumbbellChart
One row per category, with a dot for each dataset's value and a bar joining the smallest to the largest: a compact way to compare
two values per category, such as before and after. It takes labels and datasets like a horizontal bar chart,
and works with more than two datasets too. With exactly two, the tooltip also shows the change from the first to the second.
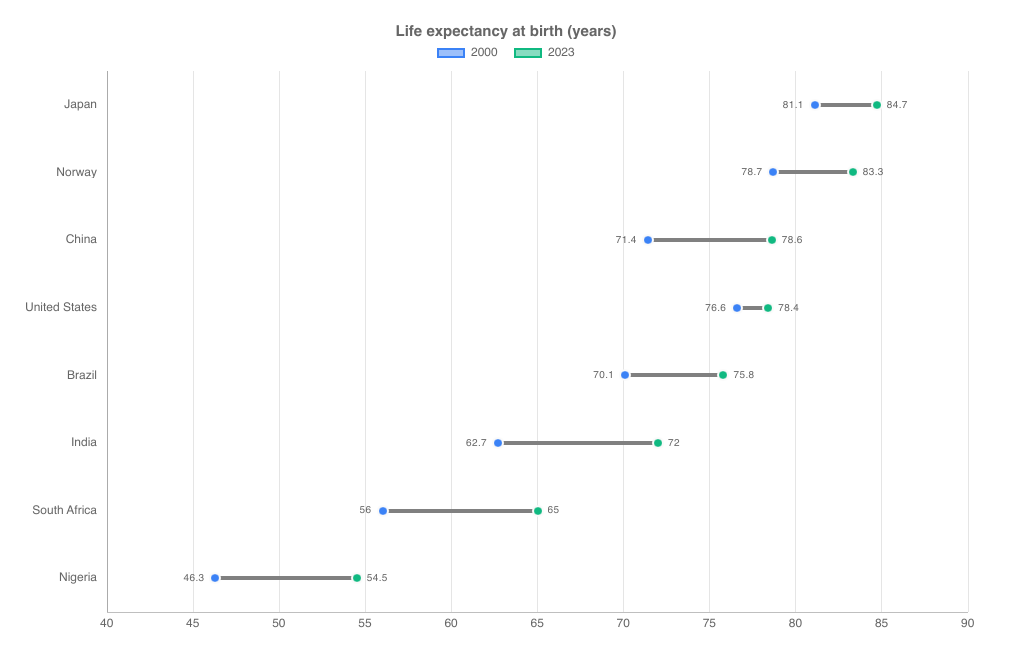
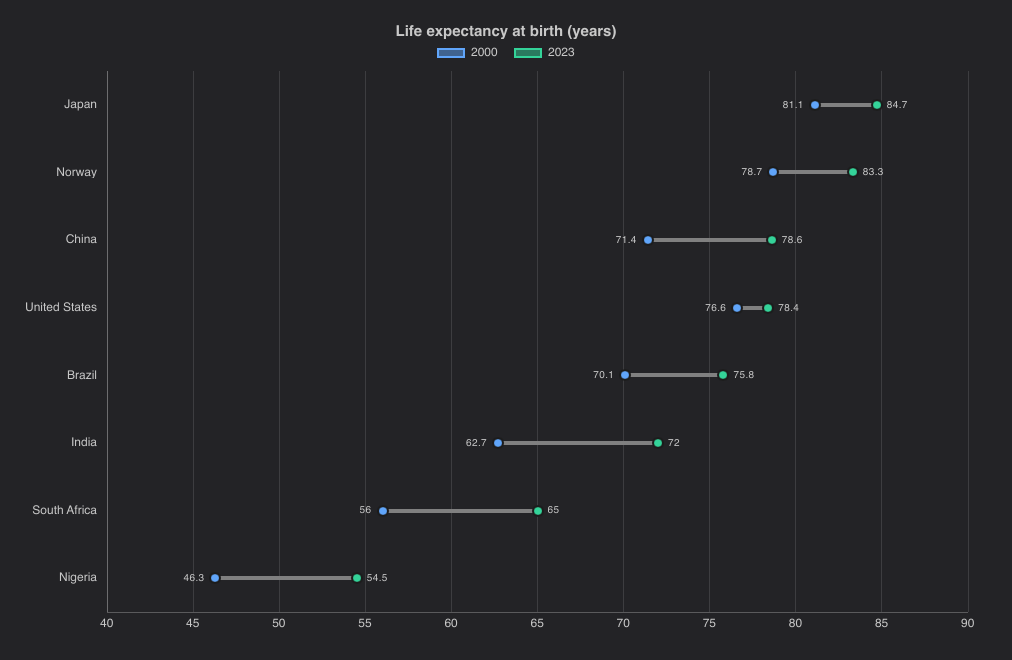
import { DumbbellChart } from "@slintplot";

DumbbellChart {
    title: "Life expectancy at birth (years)";
    labels: ["Japan", "Norway", "China", "United States", "Brazil", "India", "South Africa", "Nigeria"];
    datasets: [
        { label: "2000", values: [81.1, 78.7, 71.4, 76.6, 70.1, 62.7, 56.0, 46.3] },
        { label: "2023", values: [84.7, 83.3, 78.6, 78.4, 75.8, 72.0, 65.0, 54.5] },
    ];
    show-values: true;
    bar-color: gray;                                  // default: between the grid and axis colors
}| Property | Type | Default | Description |
|---|---|---|---|
datasets in-out | [ChartDataset] | The data, one entry per dataset: label, values, color, hidden. See ChartDataset. Each dataset is one dot per row | |
labels | [string] | One row per label | |
title | string | "" | Shown above the chart |
show-values | bool | false | Write the smallest value left of its dot and the largest right of it |
dot-radius | length | 6px | The size of the dots |
bar-width | length | 4px | The thickness of the bar between the dots |
bar-color | color | gray | The color of the bar, between the grid and axis colors |
show-legend | bool | true | A legend of the datasets; clicking an entry hides or shows one |
legend-position | ChartLegendPosition | top | top, bottom, left or right |
show-tooltip | bool | true | A tooltip with the values under the mouse |
animated | bool | true | Grow the data in when the chart appears, and move to new values |
begin-at-zero | bool | false | Include 0 in the value axis, which is horizontal |
x-title | string | "" | The title of the horizontal axis |
y-title | string | "" | The title of the vertical axis |
fixed-range | bool | false | Use min-value and max-value instead of fitting the value axis to the data |
min-value | float | 0 | The start of the value axis, with fixed-range |
max-value | float | 100 | The end of the value axis, with fixed-range |
logarithmic | bool | false | A logarithmic value axis, for values that span several powers of ten |
value-prefix | string | "" | Written before every value, such as $ |
value-suffix | string | "" | Written after every value, such as % |
value-decimals | int | -1 | Decimals of every value; -1 picks them from the data |
hovered-index out | int | The row under the mouse or selected with the keyboard, or -1 | |
category-clicked(index) | callback | A row was clicked, or chosen with Enter | |
legend-toggled(index) | callback | A legend entry hid or showed a dataset |
GaugeChart
An arc from min-value to max-value, centered at the top and covering sweep degrees, in one of two
styles after common dashboard gauges:
- Fill (the default), like ApexCharts radial bars and Highcharts solid gauges: a thick track with rounded ends,
filled up to
value, with the value large in the middle and the minimum and maximum at the ends.bandsare drawn as a thin ring outside the track, like Grafana's threshold markers, and the fill takes the color of the band the value is in. - Needle (
show-needle: true), like ECharts gauges: the bands as a thinner arc, with major and minor ticks and their labels inside it, and a needle pointing at the value, which is written below the hub.
The value is sized to the gauge, and the gauge moves smoothly to new values. Hovering a band shows its range.
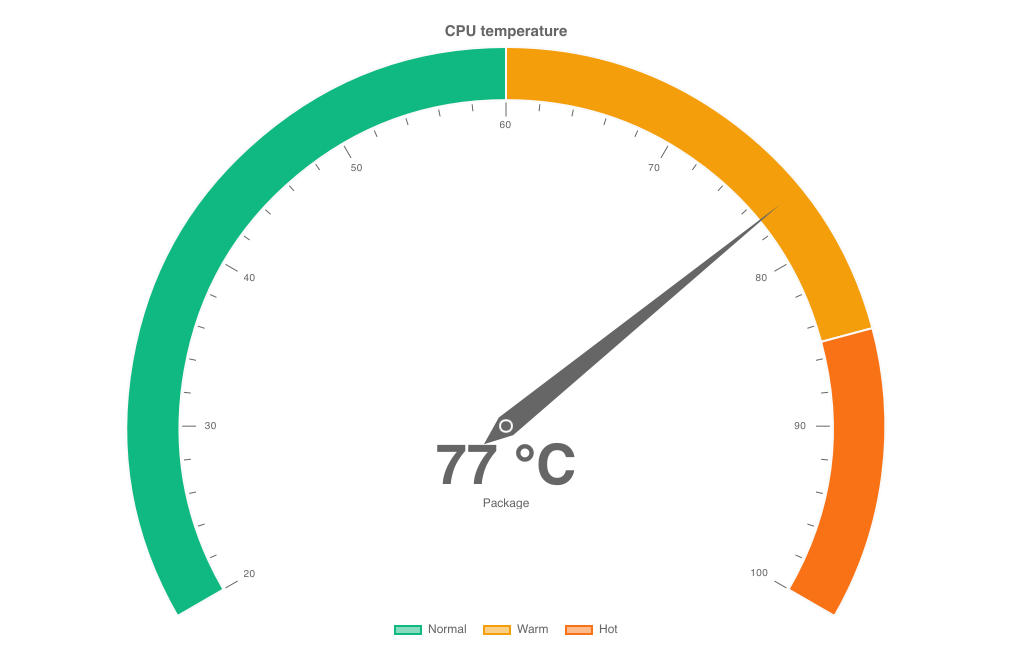
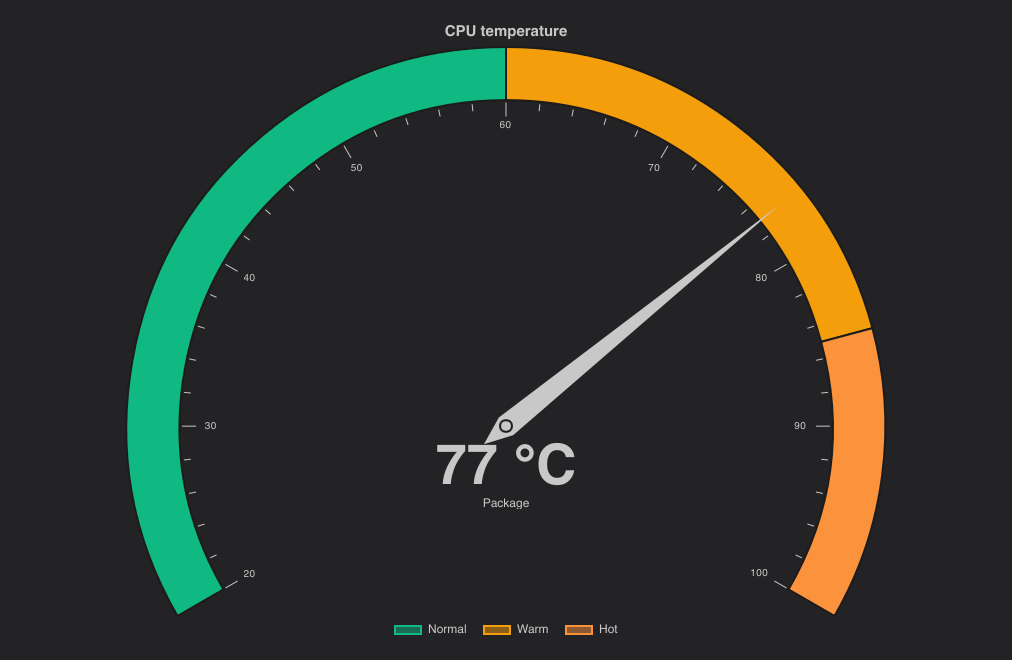
import { GaugeChart } from "@slintplot";

GaugeChart {
    title: "CPU temperature";
    value: 77;
    label: "Package";
    bands: [
        { to: 60, label: "Normal", color: #10b981 },
        { to: 85, label: "Warm", color: #f59e0b },
        { to: 100, label: "Hot", color: transparent },  // transparent: the theme's next color
    ];
    min-value: 20;
    show-needle: true;
    sweep: 240;
    show-legend: true;
    value-suffix: " °C";
    value-decimals: 0;
}| Property | Type | Default | Description |
|---|---|---|---|
value | float | 0 | The value shown; values outside the range are drawn at its ends |
min-value | float | 0 | The start of the scale |
max-value | float | 100 | The end of the scale |
title | string | "" | Shown above the chart |
label | string | "" | Written under the value |
bands | [ChartGaugeBand] | Colored ranges: to, label, color; each band starts where the previous one ends. See Data types | |
show-needle | bool | false | The needle style: the bands in full, with ticks and a needle, instead of a filled arc |
sweep | float | 180 | The angle the arc covers, in degrees |
cutout | float | 0.72, or 0.86 with a needle | The inside of the arc, as a share of the radius |
rounded | bool | true | Fill style: round ends on the arc |
show-ticks | bool | true | Needle style: ticks with labels inside the arc |
color | color | ChartTheme.colors[0] | The fill, when there are no bands |
show-min-max | bool | true | Write the minimum and maximum at the ends, unless tick labels show them |
show-legend | bool | false | A legend of the bands |
legend-position | ChartLegendPosition | bottom | top, bottom, left or right |
show-tooltip | bool | true | A tooltip with the values under the mouse |
animated | bool | true | Grow the data in when the chart appears, and move to new values |
value-font-size | length | 0px | The size of the value; 0px sizes it to the gauge |
value-prefix | string | "" | Written before every value, such as $ |
value-suffix | string | "" | Written after every value, such as % |
value-decimals | int | -1 | Decimals of every value; -1 picks them from the data |
hovered-band out | int | The band under the mouse, or -1 |
BulletChart
Rows of a bar for a value and a mark for its target, over shaded bands such as poor, OK and good, after Stephen Few's
bullet graphs: a compact alternative to a row of gauges, for dashboards and small screens. Each row has its own value axis, so
measures in different units fit in one panel; shared-axis: true puts them all on one. The axis ends with the last band.
Bands are ChartGaugeBands, the row's own or the chart's, in any order; those without a color are three steps of gray,
the first the darkest, which suit the theme in light and dark mode. Each value is written at the end of its row; the tooltip adds the
target, how far the value is from it ("+$20 (108% of target)") and the band it is in. below-target-color colors the bars of
rows that fall short, and a row's own color overrides the chart's. A target of 0 counts as none, so rows can leave it out;
set has-target: true for a real target of 0. With fixed-range, a value beyond the axis ends in an arrow.
vertical: true turns the rows into columns, with the values under them.
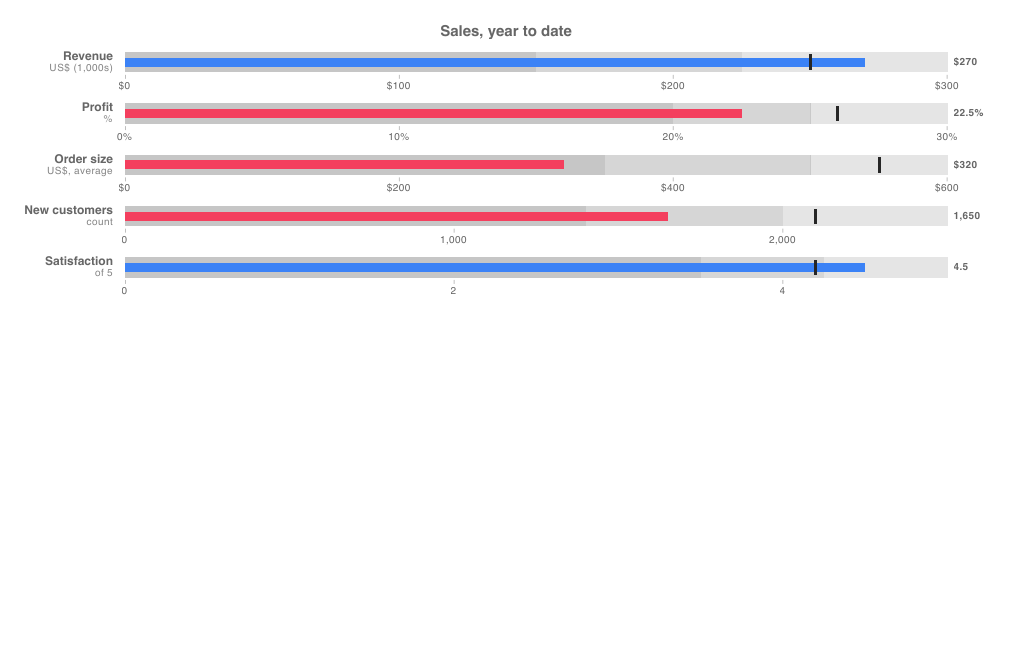
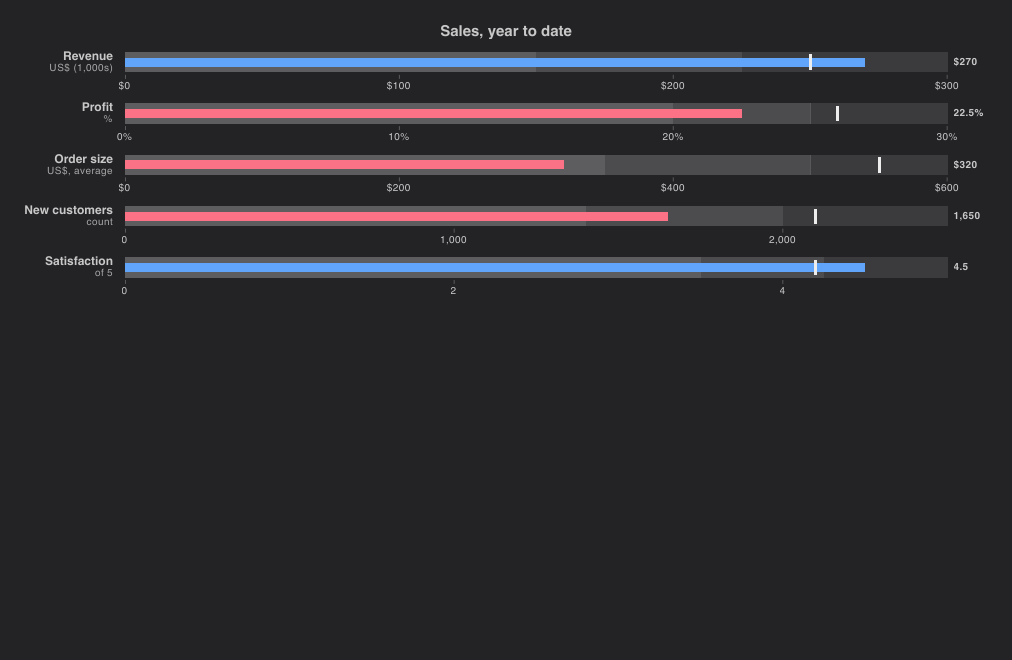
import { BulletChart, ChartTheme } from "@slintplot";

BulletChart {
    title: "Sales, year to date";
    below-target-color: ChartTheme.decrease-color;
    rows: [
        { label: "Revenue", sublabel: "US$ (1,000s)", value: 270, target: 250, prefix: "$",
          bands: [{ to: 150, label: "Poor" }, { to: 225, label: "OK" }, { to: 300, label: "Good" }] },
        { label: "Profit", sublabel: "%", value: 22.5, target: 26, suffix: "%",
          bands: [{ to: 20, label: "Poor" }, { to: 25, label: "OK" }, { to: 30, label: "Good" }] },
        { label: "Order size", sublabel: "US$, average", value: 320, target: 550, prefix: "$",
          bands: [{ to: 350, label: "Poor" }, { to: 500, label: "OK" }, { to: 600, label: "Good" }] },
        { label: "New customers", sublabel: "count", value: 1650, target: 2100,
          bands: [{ to: 1400, label: "Poor" }, { to: 2000, label: "OK" }, { to: 2500, label: "Good" }] },
        { label: "Satisfaction", sublabel: "of 5", value: 4.5, target: 4.2,
          bands: [{ to: 3.5, label: "Poor" }, { to: 4.25, label: "OK" }, { to: 5, label: "Good" }] },
    ];
}| Property | Type | Default | Description |
|---|---|---|---|
rows | [ChartBullet] | One entry per row: label, sublabel, value, target, has-target, bands, color, prefix, suffix. See Data types | |
bands | [ChartGaugeBand] | The bands of rows without their own: to, label, color; each band starts where the previous one ends | |
title | string | "" | Shown above the chart |
vertical | bool | false | Columns that grow upwards, with the labels below them |
shared-axis | bool | false | One value axis for all rows, for measures in the same unit, instead of one per row |
color | color | ChartTheme.colors[0] | The value bars of rows without their own color |
below-target-color | color | unset | The value bars of rows below their target, when set |
target-color | color | near black, near white in dark mode | The target marks |
show-values | bool | true | Each value at the end of its row, or under its column |
show-legend | bool | false | A legend of the chart's bands, or of the labelled bands of the first row with any |
legend-position | ChartLegendPosition | bottom | top, bottom, left or right |
show-tooltip | bool | true | A tooltip with the row under the mouse |
animated | bool | true | Grow the bars in when the chart appears, and move them when the values change |
fixed-range | bool | false | Use min-value and max-value for every axis instead of fitting each row; values beyond it end in an arrow |
min-value | float | 0 | The start of the value axes, with fixed-range |
max-value | float | 100 | The end of the value axes, with fixed-range |
value-prefix | string | "" | Written before every value, such as $, in rows without their own prefix |
value-suffix | string | "" | Written after every value, such as %, in rows without their own suffix |
value-decimals | int | -1 | Decimals of every value; -1 picks them from the data |
hovered-index out | int | The row under the mouse or selected with the keyboard, or -1 | |
row-clicked(index) | callback | A row was clicked, or chosen with Enter |
Axes and formatting
Cartesian charts and HorizontalBarChart share these axis options:
- Titles:
x-titlebelow the x axis,y-titleabove the y axis. - Fixed range:
fixed-range: truewithmin-valueandmax-value, so the axis stays put when the data changes. - Logarithmic axis:
logarithmic: true, with ticks at 1, 2 and 5 times powers of ten. Values that aren't positive are left out. - Formatting:
value-prefix,value-suffixandvalue-decimals(-1 for automatic) apply to the value axis, tooltips and data labels. Pies and radar charts have them too. A minus sign goes before the prefix: "-$5". Separators and dates followChartTheme.language(see Languages).
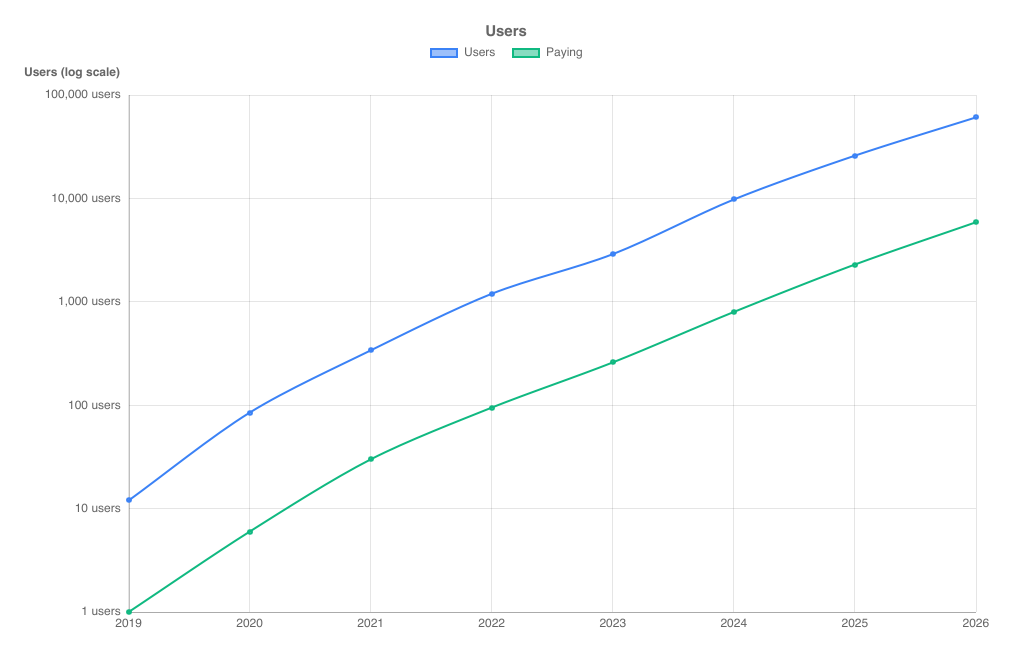
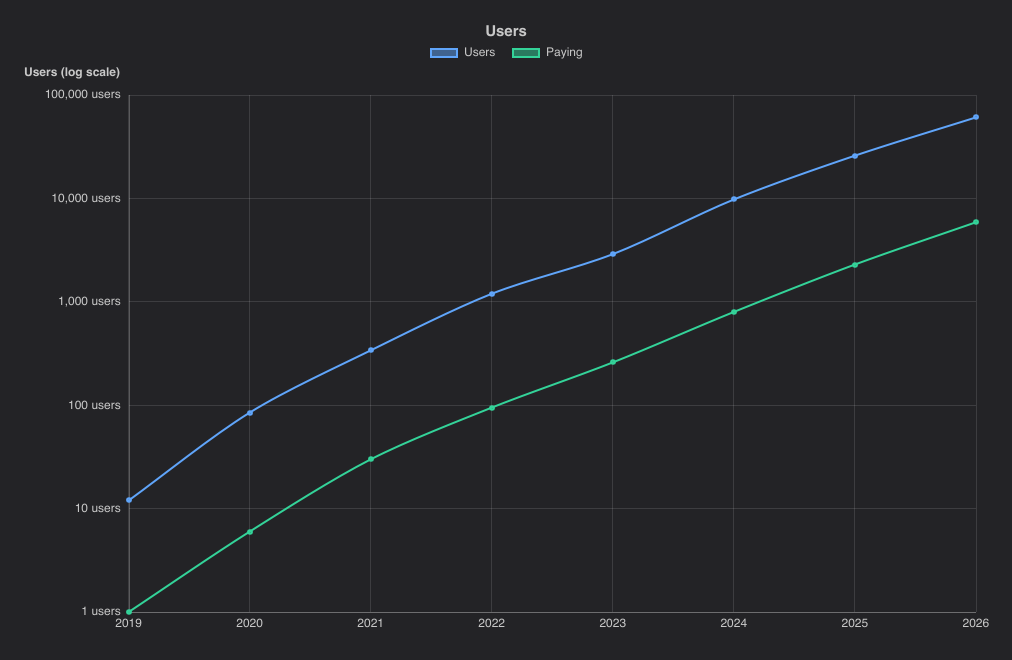
import { LineChart } from "@slintplot";

LineChart {
    title: "Users";
    labels: ["2019", "2020", "2021", "2022", "2023", "2024", "2025", "2026"];
    datasets: [
        { label: "Users", values: [12, 85, 340, 1200, 2900, 9800, 26000, 61000], tension: 0.3 },
        { label: "Paying", values: [1, 6, 30, 95, 260, 800, 2300, 5900], tension: 0.3 },
    ];
    logarithmic: true;
    y-title: "Users (log scale)";
    value-suffix: " users";
}
A second value axis
Datasets with right-axis: true are plotted against a second value axis on the right, for two measures of different
size or unit in one chart. Each axis shows while a visible dataset uses it, as with Chart.js' display: 'auto':
hide the right-axis datasets from the legend and the right axis goes, and the plot widens; hide the left ones and the grid follows the
right axis. The right axis has its own settings: y2-title,
y2-value-prefix, y2-value-suffix, y2-value-decimals, y2-fixed-range with
y2-min-value and y2-max-value, y2-logarithmic and y2-begin-at-zero.
Tooltips and data labels write each value in its own axis' format, and stacked datasets stack on their own axis.
The right axis gets as many ticks as the left one, at steps such as 15 or 40, so its ticks sit on the left axis' grid lines.
When either axis is fixed or logarithmic they can't line up; then the right axis chooses its own ticks, without grid lines.
It works in LineChart, BarChart, ScatterChart, BubbleChart and
TimeSeriesChart; other charts ignore right-axis.
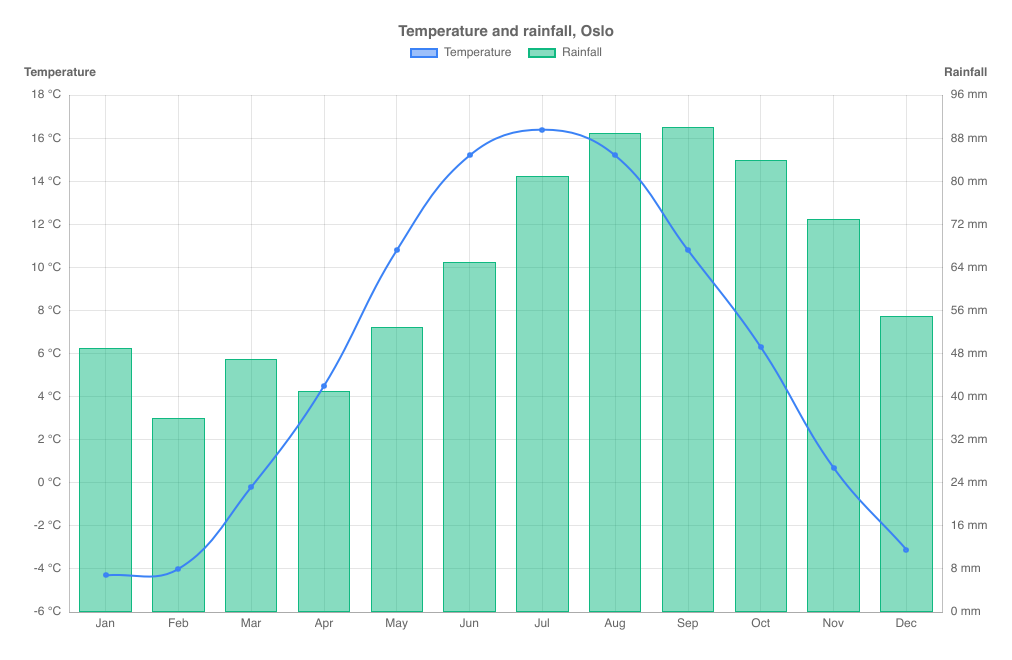
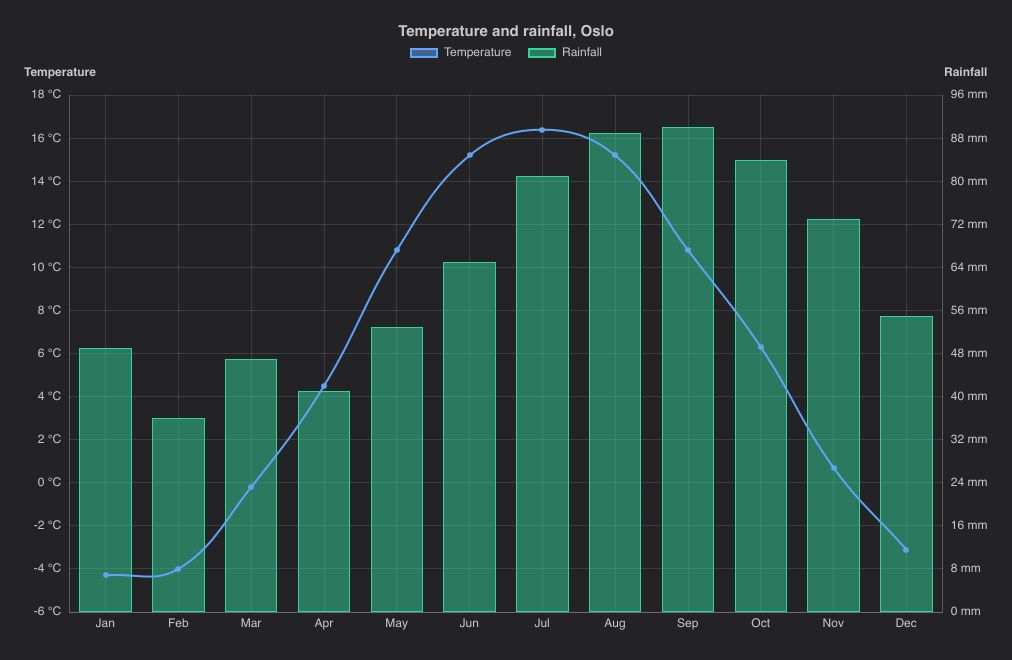
import { BarChart, ChartSeriesType } from "@slintplot";

BarChart {
    title: "Temperature and rainfall, Oslo";
    labels: ["Jan", "Feb", "Mar", "Apr", "May", "Jun", "Jul", "Aug", "Sep", "Oct", "Nov", "Dec"];
    datasets: [
        { label: "Temperature", values: [-4.3, -4.0, -0.2, 4.5, 10.8, 15.2, 16.4, 15.2, 10.8, 6.3, 0.7, -3.1], series-type: ChartSeriesType.line, tension: 0.4 },
        { label: "Rainfall", values: [49, 36, 47, 41, 53, 65, 81, 89, 90, 84, 73, 55], right-axis: true },
    ];
    y-title: "Temperature";
    value-suffix: " °C";
    y2-title: "Rainfall";
    y2-value-suffix: " mm";
}
Two value axes are easy to misread: the heights of the two datasets can't be compared, and where they cross means nothing. Give both axes a title, and make it clear which dataset belongs to which, for example with a line for one and bars for the other.
Data labels
show-values: true writes each value next to its bar or point, or inside stacked segments. Pies write the value inside
each slice, or its share with show-percentages: true; slices too thin for a label get none.
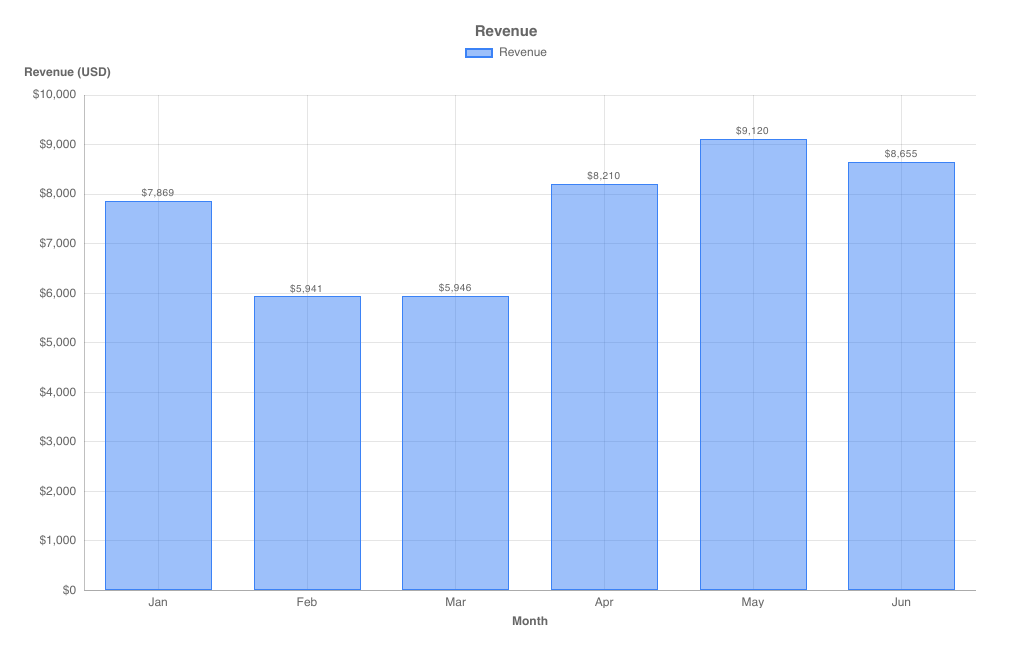
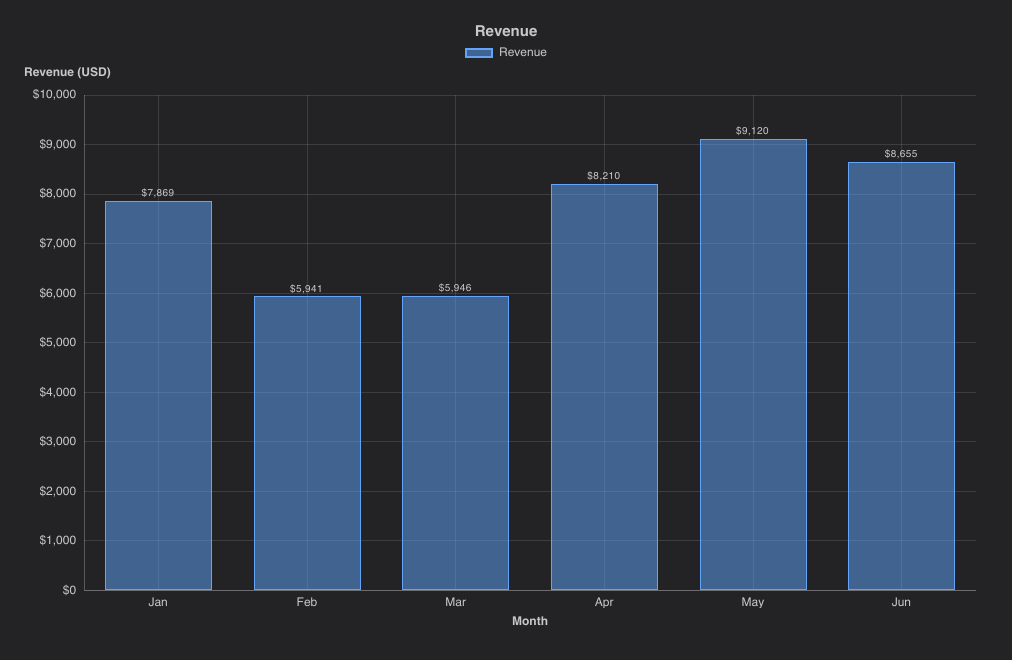
import { BarChart } from "@slintplot";

BarChart {
    title: "Revenue";
    labels: ["Jan", "Feb", "Mar", "Apr", "May", "Jun"];
    datasets: [
        { label: "Revenue", values: [7869, 5941, 5946, 8210, 9120, 8655] },
    ];
    show-values: true;
    x-title: "Month";
    y-title: "Revenue (USD)";
    value-prefix: "$";
    value-decimals: 0;
}
Cartesian properties
LineChart, BarChart, ScatterChart and BubbleChart share these properties.
| Property | Type | Default | Description |
|---|---|---|---|
datasets in-out | [ChartDataset] | The data; see ChartDataset | |
labels | [string] | Category labels on the x axis (not used by scatter and bubble charts) | |
title | string | "" | Shown above the chart |
begin-at-zero | bool | true for bars, else false | Include 0 in the value axis |
stacked | bool | false | Stack the datasets; lines and bars stack separately |
stacked-percent | bool | false | 100% stacked: each category split into the datasets' shares |
x-title, y-title | string | "" | Axis titles |
fixed-range, min-value, max-value | bool, float | false, 0, 100 | A fixed value axis |
logarithmic | bool | false | A logarithmic value axis |
value-prefix, value-suffix, value-decimals | string, int | "", -1 | How values are written; -1 decimals is automatic |
y2-title, y2-value-prefix, y2-value-suffix, y2-value-decimals | string, int | "", -1 | The second value axis, for datasets with right-axis: its title and how its values are written |
y2-fixed-range, y2-min-value, y2-max-value, y2-logarithmic | bool, float | false, 0, 100 | Its range and scale, like the left axis' properties |
y2-begin-at-zero | bool | begin-at-zero | Whether its range includes zero |
show-values | bool | false | Data labels on bars and points |
fill-opacity | float | ChartTheme.fill-opacity | Opacity of bar fills |
time-axis, time-origin, utc-offset, show-lines | Scatter charts: a time axis and lines between points (see TimeSeriesChart) | ||
show-legend | bool | true | |
legend-position | ChartLegendPosition | top | top, bottom, left or right |
show-tooltip | bool | true | |
animated | bool | true | Grow the data in when the chart appears, and move bars to new values |
show-points | bool | true | Line charts: a marker on every point. Turn off for large datasets. |
decimate | bool | true | Line charts and time series: min-max decimation when a line has more than twice as many points as the plot has pixels. Turn off to draw every point of large data. |
bar-radius | length | 0 | Corner radius of bars |
bar-border-width | length | 1px | Width of the solid bar outline |
zoom-enabled | bool | false | Mouse wheel zooms the x axis around the mouse, dragging pans, double-click resets |
view-start, view-end in-out | float | 0, 1 | The visible part of the x axis, as fractions of the full range |
min-view | float | 0.0005 | The smallest visible part when zooming |
zoomed out | bool | Whether the chart is zoomed in | |
hovered-index out | int | Line and bar charts: the category under the mouse or selected with the keyboard, or -1 | |
hovered-point out | ChartHit | Scatter, bubble and time series charts: the point under the mouse or selected with the keyboard; dataset is -1 when none |
Callbacks and functions
| Name | Description |
|---|---|
category-clicked(index: int) | Line and bar charts: a category was clicked |
point-clicked(dataset: int, index: int) | Scatter and bubble charts: a point was clicked |
legend-toggled(index: int) | A legend entry was clicked; the dataset's hidden flag has already been toggled |
reset-zoom() | Public function: show the whole x axis again |
Data types
ChartDataset
| Field | Type | Description |
|---|---|---|
label | string | Shown in the legend and tooltip |
values | [float] | One value per label (line, bar and radar charts) |
points | [ChartXY] | Scatter and bubble charts: the points, used instead of values |
color | color | Leave unset to use the next color of the theme |
hidden | bool | Hide the dataset; the legend toggles it |
fill | bool | Line and radar charts: fill the area |
tension | float | Line charts: curve tension, 0 for straight segments |
stepped | bool | Line charts: draw steps |
series-type | ChartSeriesType | auto (like the chart), line or bar |
right-axis | bool | Plot against the second value axis, on the right (see A second value axis) |
ChartXY
{ x: float, y: float, r: float }. A scatter or bubble point; r is the bubble radius in pixels and is ignored by scatter charts.
ChartSlice
{ label: string, value: float, color: color, hidden: bool }. A pie, doughnut or polar area slice, a funnel stage or a radial bar.
ChartTreemapItem
{ label: string, value: float, group: string, color: color }. A treemap item. Items with the same group are
placed together; leave color unset to use the group's color, or the theme's next color for items without a group.
ChartSunburstItem
{ label: string, value: float, parent: int, color: color, hidden: bool }. A sunburst item. parent is the index
of an earlier item, or -1 for the top level. Leave a parent's value at 0 to use the sum of its children, and color
unset for the theme's color (top level) or a lighter shade of the parent's.
ChartGanttTask
{ label: string, start: float, end: float, group: string, color: color, progress: float }. A Gantt chart task.
start and end are seconds after the chart's time-origin; a task with end equal to
start is a milestone, filled when its progress is 1. Tasks with the same group are placed together under its heading; leave color
unset to use the group's color. progress is the share done, from 0 to 1.
ChartWaterfallStep
{ label: string, value: float, total: bool }. A waterfall step: a change, or with total: true, the running total so far.
ChartCandle
{ x: float, open: float, high: float, low: float, close: float, volume: float }. A period of a candlestick chart: its time,
in seconds after time-origin, its first, highest, lowest and last value, and the volume traded in it (0 when unknown). A
missing open or close takes the other's value.
ChartGaugeBand
{ to: float, label: string, color: color }. A gauge band, from where the previous one ends (or min-value) to to.
Leave color unset for the theme's next color.
ChartBullet
{ label: string, sublabel: string, value: float, target: float, has-target: bool, bands: [ChartGaugeBand], color: color, prefix: string, suffix: string }.
A row of a bullet chart. sublabel is a smaller line under the label, such as the unit. A target of 0 counts as none,
unless has-target is set. Leave bands empty to use the chart's, color unset for the chart's, and
prefix and suffix empty to use its value-prefix and value-suffix. Bands start at the
start of the row's axis; those without a color are steps of gray, the first the darkest.
ChartHit
{ dataset: int, index: int, x: float, y: float, r: float }. The point under the mouse in a scatter or bubble chart, with its position in pixels. dataset is -1 when there is none.
ChartDateTime
{ year: int, month: int, day: int, hour: int, minute: int, second: int }. A date and time in UTC, such as a
time-origin or start-date: { year: 2026, month: 10, day: 25 }.
ChartFormat
{ prefix: string, suffix: string, decimals: int }. How a value is written; decimals: -1 chooses automatically.
Charts build it from their value-prefix, value-suffix and value-decimals properties.
ChartLocale
How numbers and dates are written, and the charts' few built-in texts. Empty fields, and name lists of the wrong length, are English.
| Field | Type | Description |
|---|---|---|
decimal, group | string | The decimal separator, and the separator between thousands, such as "\u{a0}" (a no-break space). Set only decimal for no grouping. |
percent | string | After a percentage: "%" or "\u{a0}%" |
months | [string] | The 12 short month names, January first |
weekdays | [string] | The 7 short weekday names, Monday first |
day-month, month-year, date | string | Date patterns with {d}, {MMM} and {yyyy}, such as "{d}. {MMM}", "{MMM} {yyyy}" and "{d}. {MMM} {yyyy}" |
date-time | string | A date with a time: "{date}, {time}" |
hour12, am, pm | bool, string | A 12-hour clock, as in "2:30 PM", instead of 24 hours |
less, more | string | The ends of a calendar heatmap's legend: "Less" and "More" |
no-data | string | A missing value in heatmap tooltips: "No data" |
increase, decrease, total | string | A waterfall chart's default legend, and the center of a sunburst: "Increase", "Decrease", "Total" |
running-total | string | Waterfall tooltips: "Running total" |
change | string | Dumbbell and candlestick tooltips: "Change" |
of-first-stage, of-previous-stage | string | Funnel tooltips, with {value} for the percentage: "{value} of the first stage", "{value} of the previous stage" |
on-date | string | Calendar heatmap tooltips: "{value} on {date}" |
open, high, low, close, volume | string | Candlestick tooltips: "Open", "High", "Low", "Close", "Volume" |
up-to | string | Gauge and bullet chart legends, for a band without a label: "Up to {value}" |
target, of-target, off-scale | string | Bullet chart tooltips: "Target", "{value} of target", and "Off the scale" for a value beyond a fixed axis |
Enums
| Enum | Values |
|---|---|
ChartSeriesType | auto, line, bar |
ChartLegendPosition | top, bottom, left, right |
ChartMatrixColorMode | single, rows, columns, sign, scale |
ChartPalette | modern, material, corporate, mono, pastel |
ChartLanguage | english, chinese, danish, dutch, finnish, french, german, italian, japanese, norwegian, polish, portuguese, spanish, swedish |
ChartKind | line, bar, scatter, bubble (used internally by the chart components) |
ChartChange | increase, decrease, total (waterfall bars, used internally) |
Theming
The ChartTheme global styles every chart. Assign its properties anywhere, for example in your window's init.
Colors follow light and dark mode automatically through Slint's Palette.color-scheme.
import { ChartPalette, ChartTheme } from "@slintplot";

export component App inherits Window {
    init => {
        ChartTheme.palette = ChartPalette.corporate;
        ChartTheme.fill-opacity = 0.6;
        // Or a custom palette:
        // ChartTheme.colors = [#0b6e4f, #f4a259, #5b8e7d, #bc4b51];
    }
}
Palettes
Datasets and slices without their own color take the colors of the palette in order.
| Palette | Colors (light mode) | Style |
|---|---|---|
modern (default) | Clean, saturated colors in the style of modern UI frameworks | |
material | Material Design colors | |
corporate | Restrained business colors, based on Tableau 10 | |
mono | Shades of one blue; best for up to five series | |
pastel | Soft, light colors; best for up to three series |
Each palette has separate dark mode colors. Neighboring colors, and the first three, stay distinct with red-green color blindness.
Languages
ChartTheme.language sets how every chart writes numbers and dates: the decimal and thousands separators, the
percent sign, and the month and weekday names and date order on time axes, tooltips and calendar heatmaps.
It also translates the charts' few built-in texts, such as "Less" and "More" under a calendar heatmap, a waterfall's
legend and "No data" in tooltips. Prefixes and suffixes stay as you set them, so a currency goes where value-prefix or value-suffix puts it.
import { ChartLanguage, ChartTheme } from "@slintplot";

export component App inherits Window {
    init => {
        ChartTheme.language = ChartLanguage.german;
    }
}
ChartLanguage | Number | Date | Percentage |
|---|---|---|---|
english (default) | 12,345.6 | Oct 25, 2026 | 45% |
chinese | 12,345.6 | 2026年10月25日 | 45% |
danish | 12.345,6 | 25. okt. 2026 | 45 % |
dutch | 12.345,6 | 25 okt 2026 | 45% |
finnish | 12 345,6 | 25. lokak. 2026 | 45 % |
french | 12 345,6 | 25 oct. 2026 | 45 % |
german | 12.345,6 | 25. Okt. 2026 | 45 % |
italian | 12.345,6 | 25 ott 2026 | 45% |
japanese | 12,345.6 | 2026年10月25日 | 45% |
norwegian | 12 345,6 | 25. okt. 2026 | 45 % |
polish | 12 345,6 | 25 paź 2026 | 45% |
portuguese | 12.345,6 | 25 de out. de 2026 | 45% |
spanish | 12.345,6 | 25 oct 2026 | 45 % |
swedish | 12 345,6 | 25 okt. 2026 | 45 % |
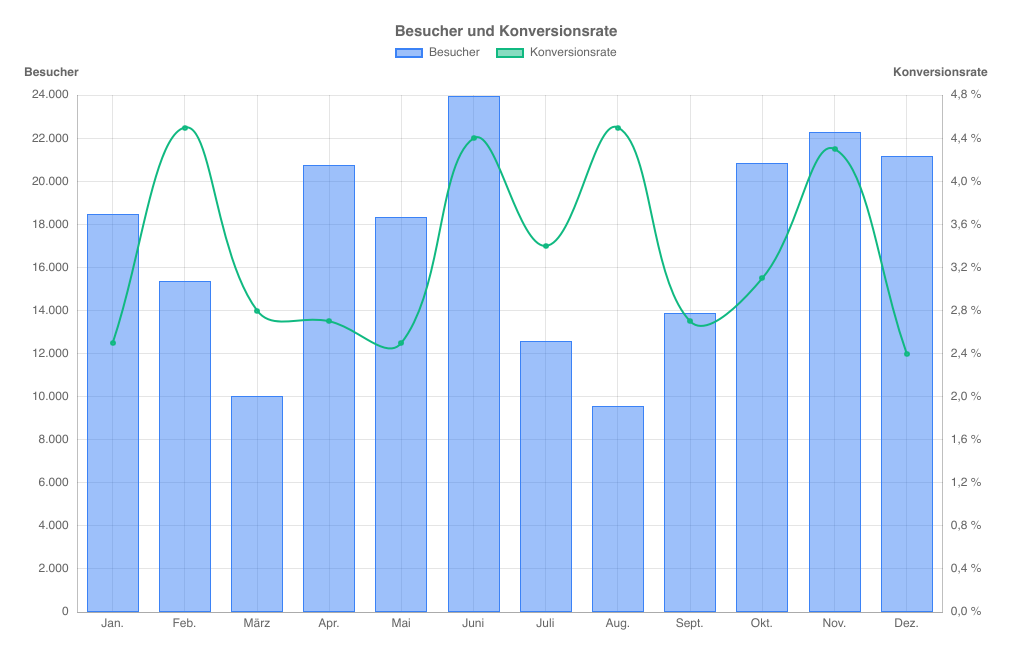
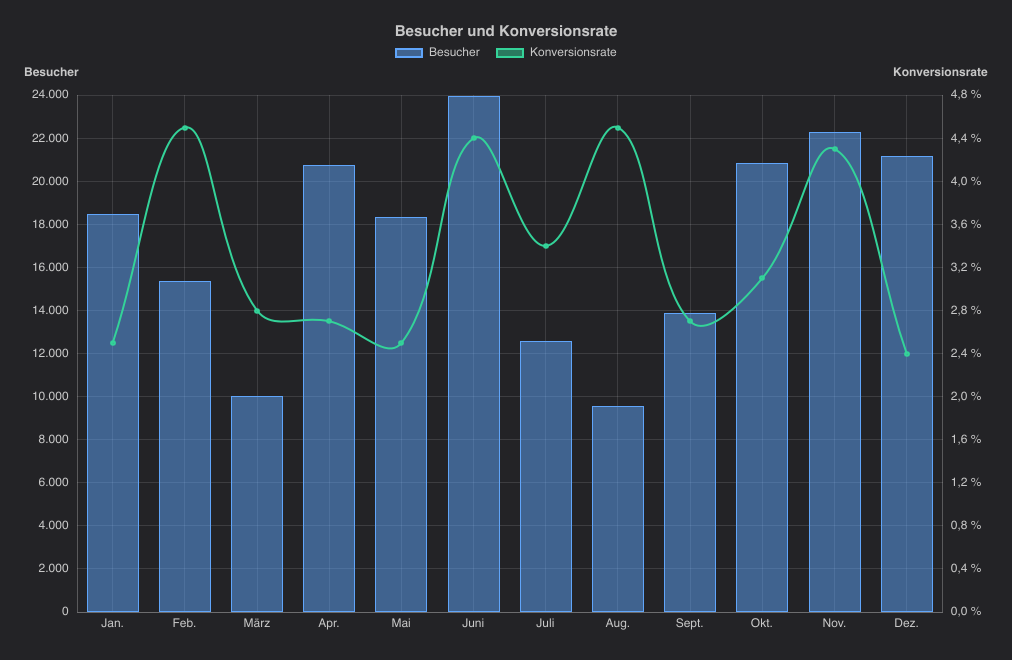
ChartTheme.language; the title and dataset names are the app's own.For other conventions, assign your own ChartLocale to ChartTheme.locale.
Fields you leave out are English:
// Swiss numbers, English dates.
ChartTheme.locale = { decimal: ".", group: "'" };
The ChartTexts global has the built-in texts in the current language, with English for empty fields, for your
own labels next to the charts. ChartTexts.percent is the percent sign, with the space some languages put before it,
for a value-suffix:
import { ChartTexts, GaugeChart } from "@slintplot";

GaugeChart {
    value: 72;
    value-suffix: ChartTexts.percent;  // "72%", or "72 %" in German
}
To follow the user's system language, read it in Rust, for example with the
sys-locale crate, and set the language. Export
ChartTheme and ChartLanguage from your root .slint file to reach them from Rust:
let language = match sys_locale::get_locale().unwrap_or_default().get(..2) {
    Some("de") => ChartLanguage::German,
    Some("nb" | "nn" | "no") => ChartLanguage::Norwegian,
    Some("sv") => ChartLanguage::Swedish,
    _ => ChartLanguage::English,
};
app.global::<ChartTheme>().set_language(language);
Japanese and Chinese need a font with their characters. Desktop systems have one; in the browser, Slint only has its built-in Inter font, so the web gallery leaves these two languages out.
The gallery's Languages sample, under Advanced, switches a chart between the 14 languages. The app translates the chart's title and dataset names itself; everything else comes from the library.
ChartTheme properties
| Property | Type | Default | Description |
|---|---|---|---|
palette | ChartPalette | modern | The built-in palette |
colors | [color] | from palette | The dataset colors for the current mode; assign for a custom palette |
dark | bool | follows Palette | Dark mode |
fill-opacity | float | 0.5 | Opacity of filled marks (bars, areas, points, bubbles, polar slices); outlines stay solid |
increase-color, decrease-color | color | a green and a red that suit palette | Rises and falls in candlestick and waterfall charts |
text-color | color | gray | Axis labels, titles and legend text |
grid-color, axis-color | color | translucent | Grid lines and axis lines |
background | brush | Palette.background | Used for slice borders and label backdrops |
tooltip-background, tooltip-text | color | dark, white | |
font-size, title-font-size | length | 12px, 15px | |
line-width | length | 2px | Line chart strokes |
point-radius, point-hover-radius | length | 3px, 5px | Point markers |
slice-border-width | length | 2px | Border between pie slices, in the background color |
slice-hover-offset | length | 8px | How far a hovered pie slice moves out |
animation-duration | duration | 900ms | Entry animation |
language | ChartLanguage | english | How numbers and dates are written (see Languages) |
locale | ChartLocale | from language | The conventions themselves; assign your own for others |
Interaction
- Tooltips and highlights. Line, bar and radar charts show every dataset's value for the category under the mouse. Scatter and bubble charts show the nearest point, pies the slice under the mouse, and treemaps and sunbursts the item under the mouse with its share of the total. Funnels add each stage's share of the first and previous stage, waterfalls the running total, dumbbells the change between two datasets, gauges the band under the mouse, bullet charts the value, target, distance to the target and band of a row, and radial bar charts the value of a ring, which stands out while the others fade. Matrix charts show the row, column and value of the cell under the mouse, with its color value, and light up its row and column.
- Legend. Clicking an entry toggles the dataset's or slice's
hiddenflag; the axes rescale to the visible data. In a treemap, it hides or shows a group, and in a sunburst a top-level item. - Clicks.
category-clicked,point-clicked,slice-clicked,item-clicked,stage-clicked,step-clicked,task-clicked,bar-clickedandcell-clickedreport what was clicked. Clicking a sunburst item with children zooms into it, and clicking the center zooms out. - Keyboard. Every chart can be used without a mouse. Click a chart (or tab to it) and a focus ring appears; the arrow
keys then move the highlight and tooltip, Home and End jump to the ends, and Enter clicks. Charts report their title as an accessibility label.
Chart Arrow keys Line, bar, horizontal bar Left and Right move through the categories Scatter, bubble, time series Left and Right move through a dataset's points in x order; Up and Down move to another dataset, at the point closest in x Pie, doughnut, polar area, radar Move around the slices or spokes Heatmap, matrix, tile grid Move from cell to cell Calendar heatmap Left and Right move a week, Up and Down a day Treemap Move through the items, group by group and largest first Sunburst Move through the items, each parent before its children; Enter also zooms into an item with children, and Escape or Backspace zooms out Funnel, dumbbell, bullet Move through the stages or rows Radial bar Move through the rings, from the outside in Segmented ring Left and Right go round a ring, Up and Down move out and in Waterfall Move through the steps Gantt Up and Down move through the tasks, scrolling them into view; with zoom-enabled, Left and Right panGauge None: a gauge shows one value, which its accessibility description reads out - Zoom and pan. With
zoom-enabled: true, the mouse wheel zooms around the mouse, dragging pans and double-clicking resets. The value axis fits the visible data.
chart := LineChart {
    zoom-enabled: true;
    labels: root.days;
    datasets: root.measurements;
    category-clicked(index) => { root.selected-day = index; }
}

Button {
    text: "Show the last 10%";
    clicked => { chart.view-start = 0.9; chart.view-end = 1.0; }
}
Updating data from Rust
Datasets and slices are ordinary Slint models. Use a VecModel and change rows; the chart updates on its own.
use std::rc::Rc;
use slint::{Model, ModelRc, VecModel};

slint::include_modules!();

fn main() -> Result<(), slint::PlatformError> {
    let app = App::new()?;
    slintplot::register!(app);

    let values = Rc::new(VecModel::from(vec![3.0, 7.0, 4.0]));
    let datasets = Rc::new(VecModel::from(vec![ChartDataset {
        label: "Sales".into(),
        values: values.clone().into(),
        tension: 0.4,
        ..Default::default()
    }]));
    app.set_datasets(datasets.clone().into());

    // Later: append a value, or replace a row.
    values.push(9.0);
    if let Some(mut ds) = datasets.row_data(0) {
        ds.fill = true;
        datasets.set_row_data(0, ds);
    }
    app.run()
}
Here App declares in-out property <[ChartDataset]> datasets; and passes it to a chart with
datasets <=> root.datasets;. The generated Rust types (ChartDataset, ChartXY, ChartSlice, ...)
come from slint::include_modules!().
Streaming
For live data, give a dataset a model that appends new values and drops the oldest. Charts read their models
on demand and follow the model's change notifications, so an update costs one frame, not a copy of the data.
VecModel works for small windows, but remove(0) moves every remaining value. For large windows, use a ring
buffer, like the StreamModel in the example apps
(stream_model.rs, about 70 lines):
/// The latest `capacity` values of a stream.
pub struct StreamModel<T> {
    values: RefCell<VecDeque<T>>,
    capacity: usize,
    notify: ModelNotify,
}

impl<T: Clone + 'static> StreamModel<T> {
    /// Appends values, dropping the oldest ones beyond the capacity.
    pub fn extend(&self, new: impl IntoIterator<Item = T>) {
        let mut values = self.values.borrow_mut();
        let before = values.len();
        values.extend(new);
        let added = values.len() - before;
        let dropped = values.len().saturating_sub(self.capacity);
        values.drain(..dropped);
        let len = values.len();
        drop(values);
        if added == 0 {
            return;
        }
        if dropped >= before {
            self.notify.reset();
        } else {
            if dropped > 0 {
                self.notify.row_removed(0, dropped);
            }
            self.notify.row_added(len - added, added);
        }
    }
}

impl<T: Clone + 'static> Model for StreamModel<T> {
    type Data = T;
    fn row_count(&self) -> usize { self.values.borrow().len() }
    fn row_data(&self, row: usize) -> Option<T> { self.values.borrow().get(row).cloned() }
    fn model_tracker(&self) -> &dyn ModelTracker { &self.notify }
}

// A time series dataset of the latest 10,000 points:
let points = Rc::new(StreamModel::new(10_000, Vec::new()));
datasets.push(ChartDataset { points: points.clone().into(), ..Default::default() });
// Later, from a timer:
points.extend(new_points);- Batch the samples. Data can arrive far faster than a screen refreshes. Collect the samples that arrived since the
last frame and add them with one
extendper frame, from aslint::Timerof about 16 ms; the stress app streams 100,000 samples a second this way. - Keep time series in time order.
TimeSeriesChartfinds the visible points with a binary search, so each dataset'spointsmust be sorted byx. Appending newer points keeps them sorted. Scatter and bubble charts take points in any order. - Let the x axis move. In line and bar charts, stream the
labelsalong with the values (anotherStreamModel), so the categories move with the data. Time series axes follow the points' times on their own. - Mind the window size. How many values a chart can show and still update at 60 frames per second depends on the chart and the machine; see streaming limits.
The gallery's Live data sample streams a time series at 10 to 60 updates a second, and the stress app streams up to 8 datasets at up to 100,000 samples a second, with windows from 1,000 values to everything it has received.
Memory stays level however long the app runs: a StreamModel holds at most its capacity, and the charts keep
nothing between frames that grows with time. The fuzz app's soak test renders the same data over and over,
with hovering, clicks, scrolling and keys, and checks that memory in use stops growing. In 10 minutes, 7,760 rounds of all 18 chart
components, it went from 870 KB after the first rounds to 874 KB at the end.
Data from other threads
Slint models live on the UI thread: a VecModel or StreamModel can't be sent to another thread, and
changing one from elsewhere doesn't compile. Read the data on any thread or async task, send it to the UI thread, and change the
models there. Two ways:
- A stream of samples (a serial port, a socket, a sensor): send them through a channel, and move what arrived into
the model once a frame, from a
slint::Timer. This also batches the samples, as Streaming recommends. - An occasional result (a database query, a file): pass a closure to the UI thread with
upgrade_in_event_loopon the component's weak handle, orslint::invoke_from_event_loop.
use std::rc::Rc;
use std::sync::mpsc;
use std::time::Duration;
use slint::{Timer, TimerMode, VecModel};

// A thread, or a tokio task, reads the samples and sends them on.
let (tx, rx) = mpsc::channel::<f32>();
std::thread::spawn(move || loop {
    let sample = read_sensor();
    if tx.send(sample).is_err() {
        break; // The app has closed.
    }
});

// On the UI thread, once a frame: move what arrived into the model.
let values = Rc::new(StreamModel::new(10_000, Vec::new()));
let timer = Timer::default();
timer.start(TimerMode::Repeated, Duration::from_millis(16), {
    let values = values.clone();
    move || values.extend(rx.try_iter())
});

// A one-off result: build the models on the UI thread.
let weak = app.as_weak();
std::thread::spawn(move || {
    let rows: Vec<f32> = fetch_rows();
    weak.upgrade_in_event_loop(move |app| {
        let values = Rc::new(VecModel::from(rows));
        // ... put `values` in a ChartDataset and set it on `app`.
    })
    .ok();
});
Keep the Timer alive as long as the chart updates: dropping it stops it. With tokio, use
tokio::sync::mpsc and its try_recv in the same way, or call upgrade_in_event_loop from the task;
Slint's event loop runs on the main thread, so run tokio on its own threads.
Large datasets
- Turn off point markers with
show-points: false. Each marker is an element. - Keep decimation on (
decimate: true, the default). A line with more than twice as many points as pixels is drawn as one span per pixel column, which looks the same and draws far faster: about 240 ms instead of 17 s for 3 lines of 1,000,000 points in the software renderer. - Zoom in. Values are read from the models on demand, so a zoomed-in chart reads only the visible values, and changes outside the view cause no work.
Measured on an Apple M4 with Slint's software renderer on one core, 1280×800 pixels, three datasets of 1,000,000 points each, decimation on (see Benchmarks for how):
| Full view | Zoomed to 0.1% | |
|---|---|---|
| Points stored | 3 × 1,000,000 | 3 × 1,000,000 |
| Points in view | 3 × 1,000,000 | 3 × 1,000 |
| Layout (reading and decimating the data) | 188 ms | 0.73 ms |
| Frame (a full redraw) | 238 ms | 46 ms |
| Hover (the next frame) | 3.1 ms |
How decimation works
Line charts, time series and scatter charts with show-lines: true decimate a line when it has more than twice as many
points as the plot is wide in pixels. Within each pixel column, the line becomes one vertical span from the lowest to the highest
point in the column, joined to the previous column. In line charts, a filled area keeps the first, lowest, highest and last point of each column.
- Peaks are kept. The lowest and highest value of every column are always drawn, so a single spike among a million points still shows. What is lost is detail inside a column: two values a pixel apart look like one span.
- Lines are straight.
tensionandsteppeddon't apply while a line is decimated, and point markers aren't drawn. Zoom in until there are fewer than two points per pixel, and the line is drawn as usual again. - The points must be in x order. Decimation groups neighbouring points by pixel column; SlintPlot doesn't sort them. Line and bar charts are always in order, since the x axis is the index. For time series, points must be sorted by time anyway (see Streaming): out of order, points can be missing from the view, and the line jumps back and forth. A scatter chart with lines joins the points in data order, decimated or not, so sort them by x first if the line should go left to right.
- Only what is shown is decimated. The data in your models isn't changed. Tooltips and
hovered-indexreport the real values.
Missing and invalid values
NaN and infinite values mark a value as missing; both behave the same. A missing value never stops a chart: it is left out, and the axes are computed from the remaining values.
| Chart | A missing value |
|---|---|
| Line | No point. The line joins the values either side of it, without a gap. |
| Bar, horizontal bar | No bar; the category stays. In stacked charts it adds nothing to the stack. |
| Scatter, bubble, time series | The point is left out if its x or y is missing. A bubble with a missing radius is drawn as an ordinary point. |
| Pie, doughnut, polar area | The slice isn't shown, as with zero and negative values. |
| Radar | No point on that spoke. |
| Heatmap | An empty cell. |
| Matrix | No circle, as with zero; row and column totals leave it out. |
| Calendar heatmap | A day without activity, as with zero. |
| Treemap | The item isn't shown. |
| Sunburst | The item counts as 0: it isn't shown, unless it has children, which are. |
| Funnel | A stage of 0. |
| Waterfall | The step adds nothing; the running total carries on. |
| Gauge | The needle or fill stays at min-value. |
| Bullet | No bar, or no target mark; the row stays. |
Values outside a fixed range (fixed-range: true) lie off the plot, which is then clipped: lines towards them
end at its edge. On a logarithmic axis, zero and negative values lie below the bottom of the axis.
Settings are kept to what can be drawn: tension above 1 draws as 1, a CalendarHeatmap has 1 to 20 levels,
and a line or bar chart zoomed in to less than one category shows one category across the plot.
The fuzz app feeds every chart random data with NaN, infinities, the largest and smallest floats, empty and very long lists, and out-of-range settings, renders it at sizes down to 1×1 pixel, and moves the mouse and keyboard over it, checking that nothing panics, hangs or runs out of memory.
Rust API
slintplot::library_path() -> PathBuf
The path to the library's .slint entry point, for CompilerConfiguration::with_library_paths in build.rs.
Register it under the name slintplot to import from "@slintplot".
slintplot::register!(component)
Connects the ChartEngine global of a component to SlintPlot. Call it once after creating the component.
The Chart* types generated by slint::include_modules!() must be in scope where you call it,
and the root .slint file must export { ChartEngine }.
slint::include_modules!();
let app = App::new()?;
slintplot::register!(app);
slintplot::profile
| Function | Description |
|---|---|
last_layout_time() -> Duration | How long the most recent chart layout took, including reading the models |
take_totals() -> (u32, Duration) | The number of layout and axis computations, and their total time, since the previous call |
Layout modules advanced
The geometry behind the components is public, for tests, custom renderers or server-side use. These modules may change before 1.0.
| Module | Main items |
|---|---|
slintplot::layout | layout(&LayoutRequest) -> Layout, value_axis(&AxisRequest) -> Axis, Dataset, Values, DataPoint, Kind, Stacks, plotted_value, nearest_point, category_window, resolve_color, PALETTE |
slintplot::pie | layout(&PieRequest) -> PieLayout, hit(&PieLayout, x, y) |
slintplot::radar | layout(&RadarRequest) -> RadarLayout, hit(&RadarLayout, x, y) |
slintplot::segmented | layout(&SegmentedRequest) -> Segmented, dimensions, paint, cell_color, cell_path, hit |
slintplot::radial | layout(&RadialBarRequest) -> RadialBars, bar_path, value_spot, hit |
slintplot::time | time_ticks, format_datetime (English), time_ticks_in, format_datetime_in (a Locale), unix_seconds, days_from_civil, civil_from_days |
slintplot::gantt | rows (groups and headings), window, layout(&GanttRequest) -> Gantt (rows in view, bars, ticks), duration |
slintplot::heatmap | calendar, calendar_in (calendar layout and quantile levels), weekday_labels, extent |
slintplot::tiles | layout(&TileRequest) -> Tiles, dimensions, paint, tile_path, hit |
slintplot::matrix | layout(&MatrixRequest) -> Matrix (circles, merged blocks, totals, size legend), radius, nice_below |
slintplot::ticks | NiceScale (round tick spacing), Format, log_ticks, format_tick, format_value (English) |
slintplot::locale | Locale: separators, names and date patterns, with number, tick, value, date and time |
slintplot::path | line, area, band, steps: SVG path commands for Slint's Path |
use slintplot::ticks::{NiceScale, format_tick};

let scale = NiceScale::new(3.0, 97.0, 6);
assert_eq!((scale.min, scale.max, scale.step), (0.0, 100.0, 20.0));
let labels: Vec<String> = scale.ticks().iter().map(|&v| format_tick(v, scale.step)).collect();
// ["0", "20", "40", "60", "80", "100"]
ChartEngine
ChartEngine is the Slint global that the chart components call to compute their geometry. You don't call it yourself,
but it has to be exported from your root .slint file so that register! can connect it.
Its pure callbacks include layout, value-axis, pie-layout, radar-layout, treemap-layout,
sunburst-layout, funnel-layout, waterfall-layout, dumbbell-layout, gantt-layout, gauge-layout, bullet-layout,
candle-layout, radial-bar-layout, matrix-layout, the hit tests and format-value. moving-average(candles, period) is for you: the simple
moving average of the closes, as points for a line over a CandlestickChart; in Rust,
slintplot::candle::moving_average computes the same.
Example apps
Two apps show the library in use. They are published on crates.io, so you can install them with Cargo (Rust 1.88 or later):
cargo install slintplot-gallery
cargo install slintplot-stress
Then run slintplot-gallery or slintplot-stress. On Linux, Slint needs the fontconfig and xkbcommon
development packages first, such as libfontconfig-dev and libxkbcommon-dev on Debian and Ubuntu.
| Command | What it shows |
|---|---|
slintplot-gallery | A sample browser: every chart type, with Randomize, Add dataset, Add data, Remove dataset and Remove data buttons, a theme selector and dark mode. The code button (</>) shows the sample as a small Rust app, a file per tab: its Slint code as a complete window with the data it shows at that moment, main.rs, build.rs, Cargo.toml and how to run it, with a Copy button, and clicking a chart shows the click callback and what was clicked at the bottom right |
slintplot-stress | Streams line, bar, time series and scatter charts with up to 8 datasets: 10 to 100,000 samples a second, a window from 1,000 to 10,000,000 values or everything received, and random walk, sine, square or noise signals with optional spikes. Also waterfall, dumbbell, funnel and sunburst charts and a gauge; points, smoothing, fill, steps, decimation, zoom, themes, and live frame times. Streaming stops by itself if the chart falls more than 3 seconds behind. |
slintplot-gallery --snapshot <dir> | Renders every gallery sample to PNG without a window |
slintplot-stress --bench | Headless timings for 100 to 1,000,000 points, then the streaming limits; see Benchmarks. --bench-gpu times the same charts with Skia. |
slintplot-stress --bench-stream | Only the streaming limits, with the machine they were measured on |
slintplot-stress --snapshot <dir> | Renders the stress test screenshot, in light and dark mode, to PNG |
Choosing a renderer
Both apps draw with Slint's FemtoVG renderer, on the GPU, by default. To compare, pick another renderer with the SLINT_BACKEND
environment variable when you start the app. Skia needs the app built with its skia feature:
SLINT_BACKEND=winit-software slintplot-gallery    # Slint's software renderer, on the CPU
SLINT_BACKEND=winit-femtovg slintplot-gallery     # FemtoVG, the default
cargo install slintplot-gallery --features skia
SLINT_BACKEND=winit-skia slintplot-gallery        # Skia, on the GPU
The same works for slintplot-stress, whose frame times then show the chosen renderer's speed. The renderer is picked when the app starts;
switch by starting it again. In your own app, see Slint's backends and renderers.
The ready-built apps on the releases page include FemtoVG and the software renderer, not Skia.
The source of the apps is on GitHub, in examples/gallery
and examples/stress.
The gallery's ui/gallery.slint has a working example of every chart; the gallery's code view shows each one, taken from that file when the app is built, with the data filled in so it runs as it is.
A third app, examples/fuzz, tests the library rather than showing it, and runs from a clone of the repository. It feeds every chart random and malformed data (see Missing and invalid values) and stops with the round, chart and seed that reproduce a panic, a hang or a runaway allocation. Its soak test repeats the same rounds for a while and checks that memory in use levels off.
cargo run --release -p slintplot-fuzz -- 300 42     # 300 rounds from seed 42
cargo run --release -p slintplot-fuzz -- soak 60    # an hour of the same rounds
The gallery also runs in the browser, built with WebAssembly: slintplot.dev/demo.
Ready-built apps for macOS, Windows and Linux are on the releases page. Each download includes the licenses of the open-source crates it is built from.

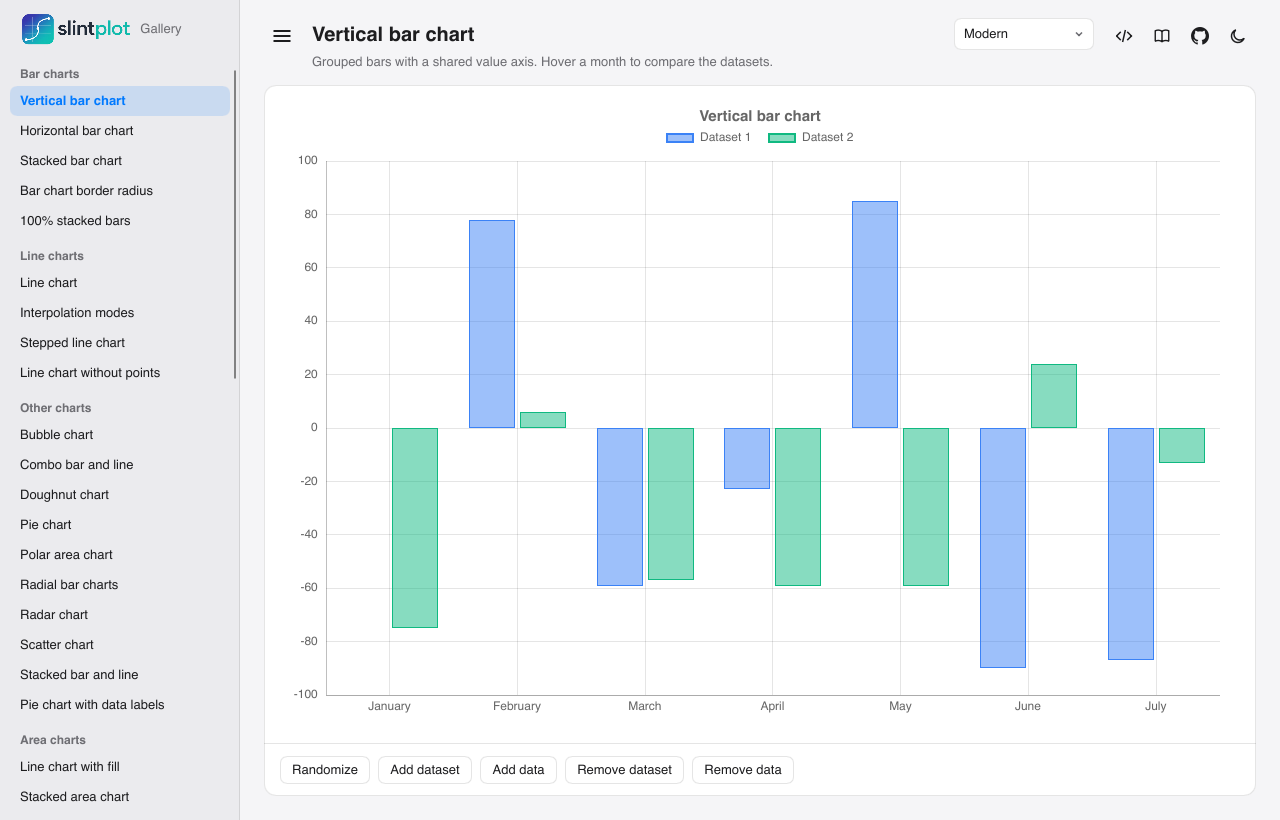
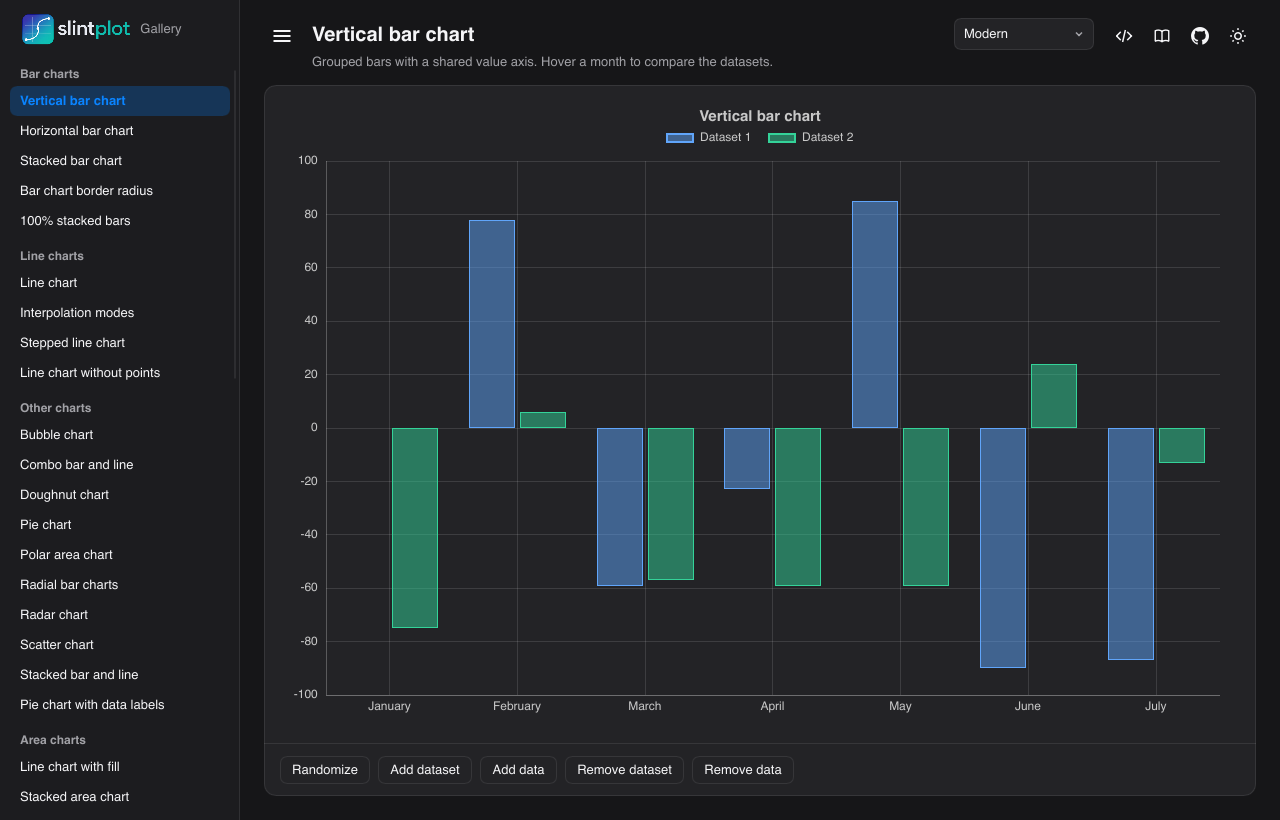
Performance
SlintPlot draws every chart with Slint's own elements: a path per line, a rectangle per bar, a text per label.
That keeps charts sharp, themeable and interactive, but every element costs drawing time, and that cost
grows with the data. The stress test app, slintplot-stress, was built to find where it starts to
matter: it pushes each chart type from 100 to 1,000,000 points, streams new data at 60 Hz, and shows the
layout and frame times live. Use it to check what's fast enough for your app before you build it; we use it to
catch slowdowns in SlintPlot before a release.
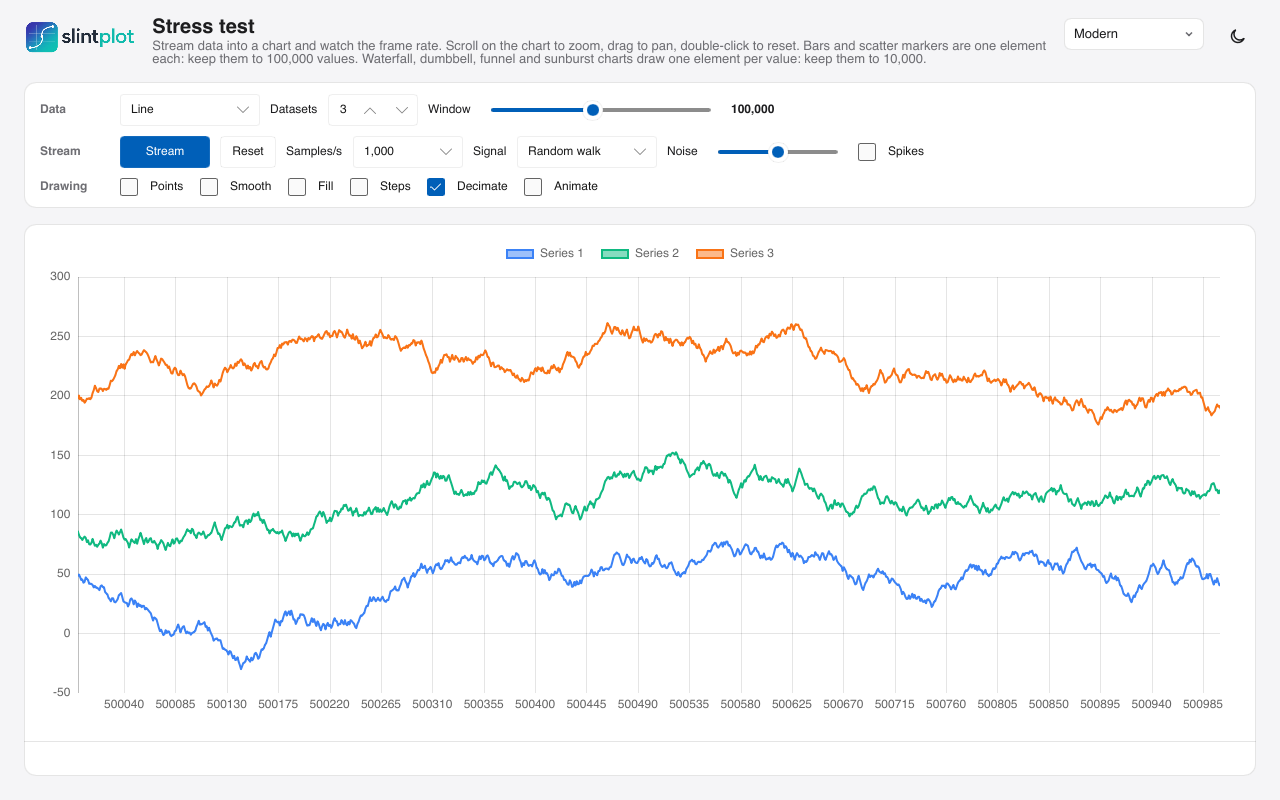
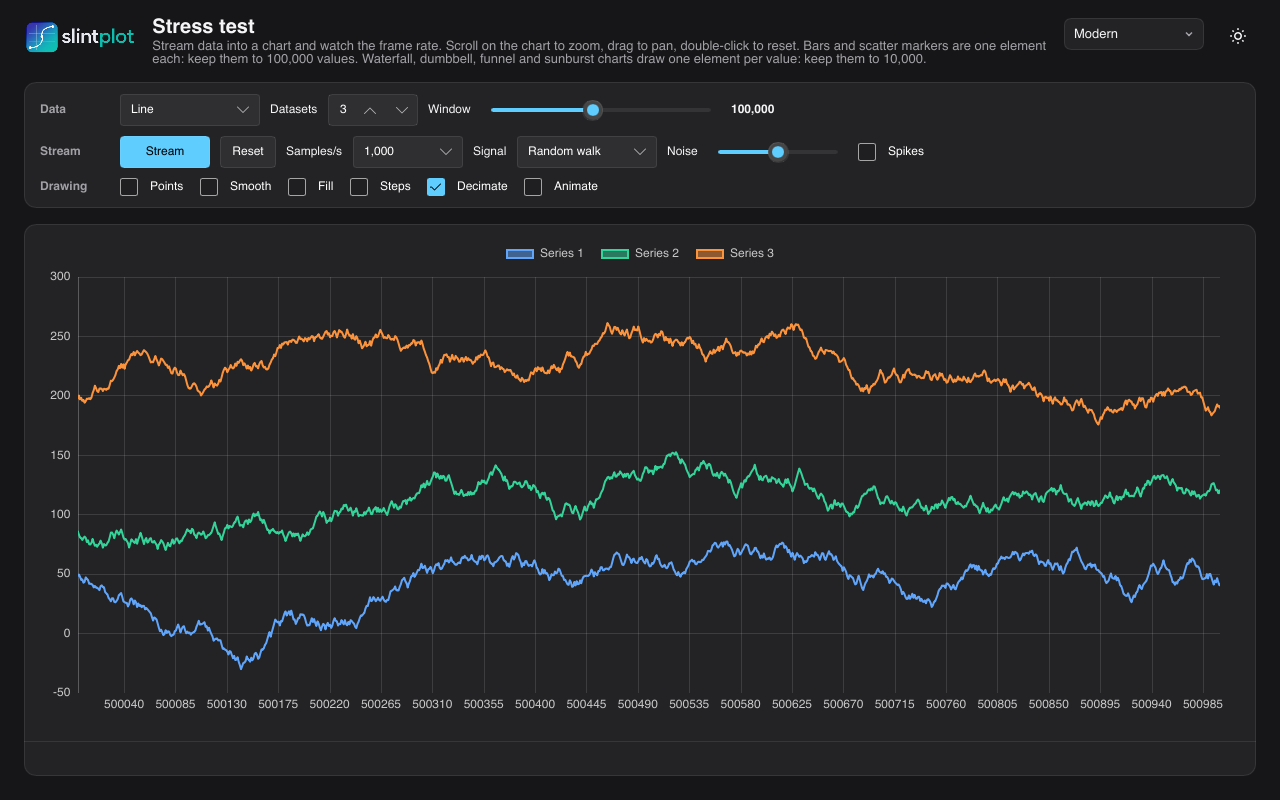
How much a chart can show
The most points or items a chart can have and still draw a frame with new data within 16.7 ms (60 frames per second, for animation and live data), within 33.3 ms (30 frames per second, smooth enough to interact with) or within 1 second (charts that change now and then). Measured with SlintPlot 0.5.0 and Slint 1.18.1 on an Apple M4 at 1280×800 pixels with three datasets, in steps of ten (100, 1,000, 10,000 and so on), for Slint's software renderer and for Skia, which draws on the GPU:
| Chart | Software renderer | Skia (GPU) | ||||
|---|---|---|---|---|---|---|
| 60 fps | 30 fps | 1 s | 60 fps | 30 fps | 1 s | |
| Lines, decimated (the default), points per dataset | 10,000 | 100,000 | 1,000,000+ | 10,000 | 100,000 | 1,000,000+ |
| Lines, not decimated | 1,000 | 1,000 | 10,000 | 1,000 | 1,000 | 100,000 |
| Lines with point markers | 1,000 | 1,000 | 10,000 | 100 | 1,000 | 10,000 |
| Bars, per dataset | 1,000 | 10,000 | 100,000 | 1,000 | 1,000 | 100,000 |
| Scatter markers, per dataset | 1,000 | 10,000 | 10,000 | 1,000 | 1,000 | 10,000 |
| Waterfall steps, funnel stages | 1,000 | 1,000 | 10,000 | 1,000 | 1,000 | 10,000 |
| Dumbbell rows | 1,000 | 1,000 | 10,000 | 100 | 1,000 | 10,000 |
| Sunburst items | 100 | 1,000 | 10,000 | 100 | 1,000 | 10,000 |
| Segmented ring cells | 1,000 | 1,000 | 36,000 (all) | 1,000 | 1,000 | 36,000 (all) |
| Tile grid cells | 1,000 | 1,000 | 100,000 | 1,000 | 1,000 | 100,000 |
1,000,000+ is the largest size tried; 36,000 cells is the most a segmented ring chart shows. The streaming limits on the benchmarks page narrow it down further for lines, bars and scatter charts, in steps of 1, 2 and 5.
- Keep decimation on for long lines. It's on by default: a line with more points than pixels is drawn as one span per pixel column, so even a million points per dataset redraw in about 240 ms, and zoomed in, only the points in view count.
- For animation and live data, keep separate shapes to about 1,000. Bars, markers, steps, rows and items are one shape each, and each costs drawing time.
- Redrawing without new data is cheaper. Hovering, for example, takes about 3 ms in the software renderer even for a decimated million-point line, and Skia redraws most charts in half the time of a frame with new data.
- The GPU isn't faster for everything. Skia draws long lines faster: a million points without decimation take 3.3 s instead of 17 s. But on this Mac it's slower for many separate shapes: 10,000 scatter markers take 102 ms instead of 23 ms (see why).
Why the numbers look like this
A frame's cost has two parts: building the chart (reading the data and working out the shapes, in SlintPlot) and drawing it (in Slint's renderer). Which one dominates depends on the chart:
- Each shape has a fixed cost. Slint draws a chart element by element: every bar, marker or item is visited, set up and drawn on its own. A few hundred shapes cost almost nothing; tens of thousands add up, whatever their size. That's why charts of separate shapes have the lowest limits.
- A line is one shape, however long. Its cost grows with the number of points in it, not with a count of elements. Decimation keeps that number down to about two per pixel column, so a million-point line costs little more to draw than a ten-thousand-point one; what's left is reading the data.
- The software renderer pays by the pixel. It fills each shape's pixels on one CPU core, so small shapes such as markers and thin bars are cheap, while long lines with many edges and large filled areas are expensive.
- The GPU pays by the draw. Skia hands each shape to the GPU as a separate command. The GPU fills pixels in parallel, so long lines and large areas are fast, but every command costs CPU time to prepare, and the GPU can't combine shapes that are drawn one at a time. With many small shapes, that preparation is the bottleneck and the GPU waits; that's why Skia is slower than the software renderer for 10,000 markers, and faster for a million-point line.
- Nothing changed, less to do. When only the mouse moves, the chart isn't built again, and Skia keeps the shapes it has prepared, so redraws are cheaper than frames with new data.
The benchmarks page has every measured time, how they were measured, and how to run the benchmarks on your own machine.
Limitations
What SlintPlot 0.5 doesn't do yet, or does with restrictions:
- Rust only. The chart geometry is computed in Rust and connected with
register!, so the library can't be used from Slint's C++, JavaScript or Python APIs. For the same reason, charts aren't drawn in Slint's live preview or SlintPad. - Platforms. Tested on desktop (macOS, Windows and Linux) and in the browser with WebAssembly, from version 0.1.2: the gallery runs in the browser. Embedded (MCU) builds are untested. With Slint's software renderer, enable its
software-renderer-pathfeature, or charts aren't drawn. - 14 built-in languages.
ChartTheme.languagecovers 14 languages; for others, set theChartLocalefields yourself. Grouping is always in thousands (no Indian lakh grouping, and four-digit numbers are grouped in every language), digits are Western, and right-to-left layout isn't supported. - Time zones. Time axes are in UTC, with an optional fixed offset. Named time zones and daylight saving time changes aren't supported.
- Two value axes at most, and only in line, bar, scatter, bubble and time series charts: horizontal bar charts have one value axis.
- Zoom, pan and decimation work in the cartesian charts only (line, bar, scatter and time series), and in candlestick and Gantt charts along time. Zoom is off by default.
- Eight colors per theme. With more than eight datasets the colors repeat. Set your own palette for more (see Theming).
- Large charts of separate shapes are slower. Sunburst, waterfall, dumbbell and funnel charts draw every item as its own shape: about 270 ms for a sunburst with 10,000 items, and about 80–100 ms for waterfall and dumbbell charts. With up to 1,000 items, a frame takes under 30 ms. Decimation applies to lines only.
- Label fitting is estimated. Sunburst and treemap labels are kept or hidden from an estimate of the text width, so very wide or narrow fonts can be clipped or hidden too early.
- No image or PDF export. To save a chart as PNG, render the window with Slint's software renderer, as the gallery's
--snapshotoption does. - Sunburst data order. A parent item must come before its children in
items. - Requirements. Slint 1.18 or later and Rust 1.88 or later.
Pricing
SlintPlot is free for open-source software under the GPLv3 and for noncommercial use (see License). A commercial license lets you use it in closed-source software you sell, ship or deliver to clients. Licenses are per developer, per year, and cover any number of your products.
Early bird: half price for your first two years. Buy by 31 December 2027: the discount covers your first year and your first renewal. Early adopters also help shape SlintPlot: your feature requests and feedback come first when we plan what to build next.
Indie
Solo developers and companies with under €250,000 in annual revenue
- Closed-source apps and devices
- Any number of products
- All updates while licensed
- Keep shipping what you released, after it ends
- Email support
Business
For every other company
- Everything in Indie
- Priority email support
- Invoice and purchase order on request
Enterprise
Large teams and custom terms
- Every developer in the company
- Custom license terms
- Support with a response time
Prices exclude VAT. Payments are handled by Paddle, which is the seller of record and sends the invoice. A developer is anyone who writes code that uses SlintPlot. Perpetual fallback: products you release while your license is active may keep being sold and shipped after it ends, with the SlintPlot version they were built with; new products and newer SlintPlot versions need an active license. Your application also needs a suitable Slint license. Questions: license@slintplot.dev.
License
SlintPlot is available under your choice of three licenses:
- GPLv3: free for anyone, for any purpose, under the GNU GPL, version 3. Software that includes SlintPlot and is distributed to others must be distributed under the GPLv3, with its source code.
- PolyForm Noncommercial: free for personal, hobby, research, education and other noncommercial use, with or without sharing your source code, under the PolyForm Noncommercial License 1.0.0.
- Commercial: for commercial use without the GPLv3's conditions, such as in closed-source software you sell or ship. See Pricing.
LICENSE.md and COMMERCIAL.md have the details. Your application also needs a suitable Slint license.
SlintPlot is an independent project. It is not affiliated with, endorsed by or sponsored by SixtyFPS GmbH or the Slint project. Slint and the Slint logo are trademarks of SixtyFPS GmbH.
SlintPlot · slintplot.dev · license@slintplot.dev
Not affiliated with SixtyFPS GmbH or the Slint project.